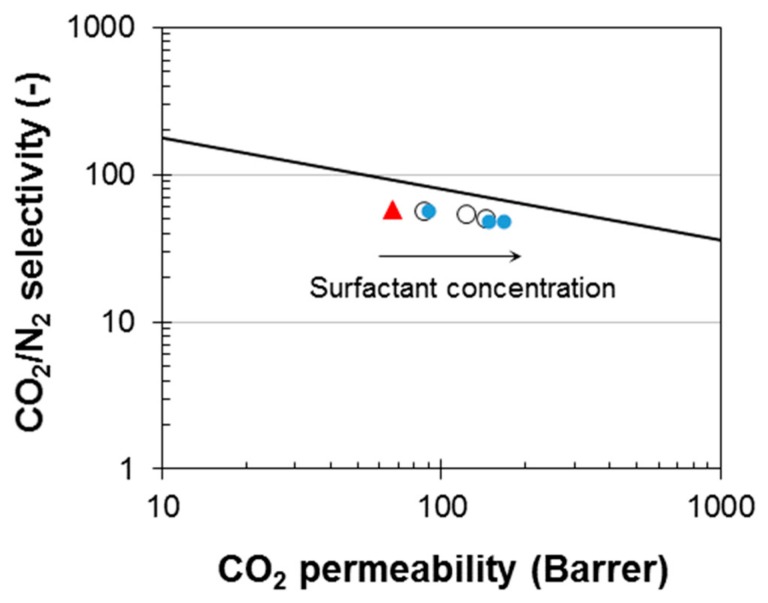
Figure 7.
Robeson’s plot for the CO2/N2 pair showing the data of the prepared membranes. Red triangle (neat Pebax® 1657); open circles (Pebax/T20); closed circles (Pebax/T80). The black line represents the 2008 upper bound [28]. The arrow indicates the increasing concentration of the surfactants in the prepared membranes.

