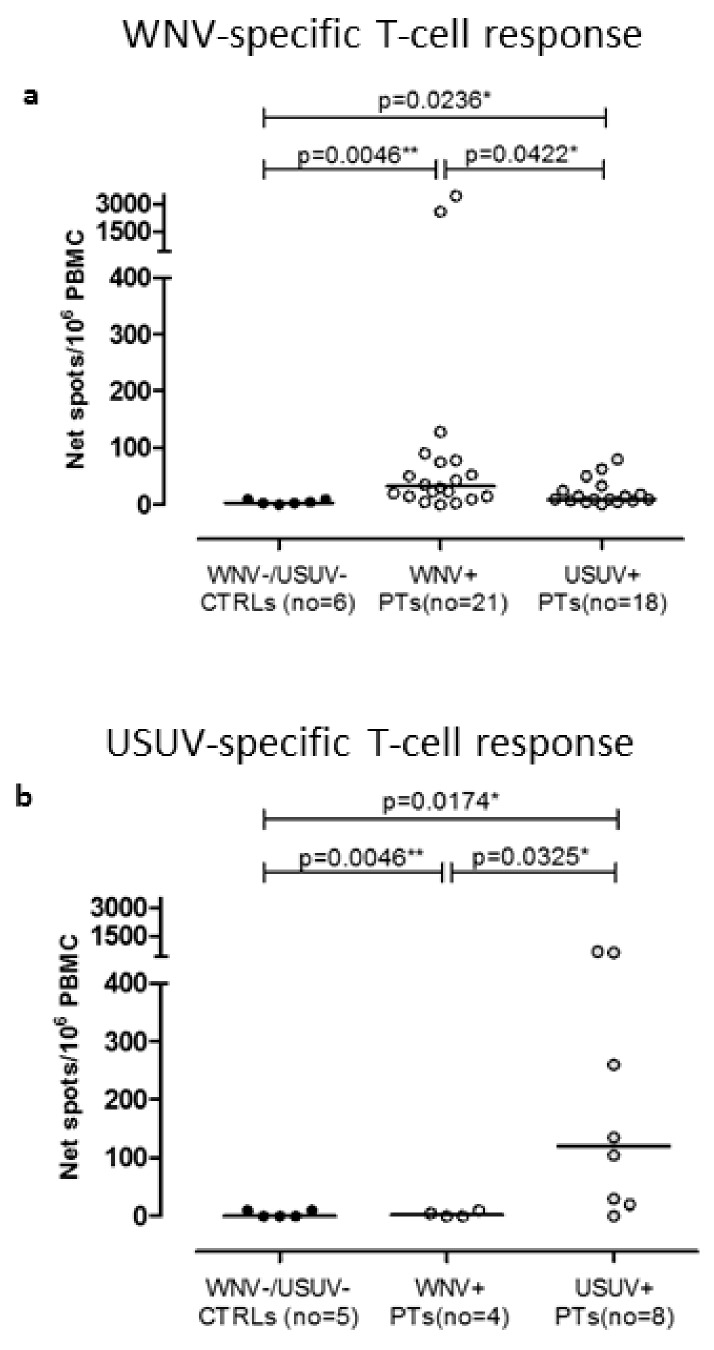
Figure 2.
WNV-specific T-cell response was measured in six WNV−/USUV− healthy volunteers (WNV−/USUV− controls (CTRLs)), 21 WNV true blood donors (WNV+ BDs), and 18 USUV true blood donors (USUV+ BDs) (a). Similarly, USUV-specific T-cell response was evaluated in five WNV−/USUV− healthy volunteers (WNV−/USUV− CTRLs), four WNV true blood donors (WNV+ BDs), and eight USUV true blood donors (USUV+ BDs) (b). Medians of WNV-specific T-cell response are given in the graph for all the three groups of subjects and p-values were measured using Mann-Whitney test (* p < 0.05; ** p < 0.01).

