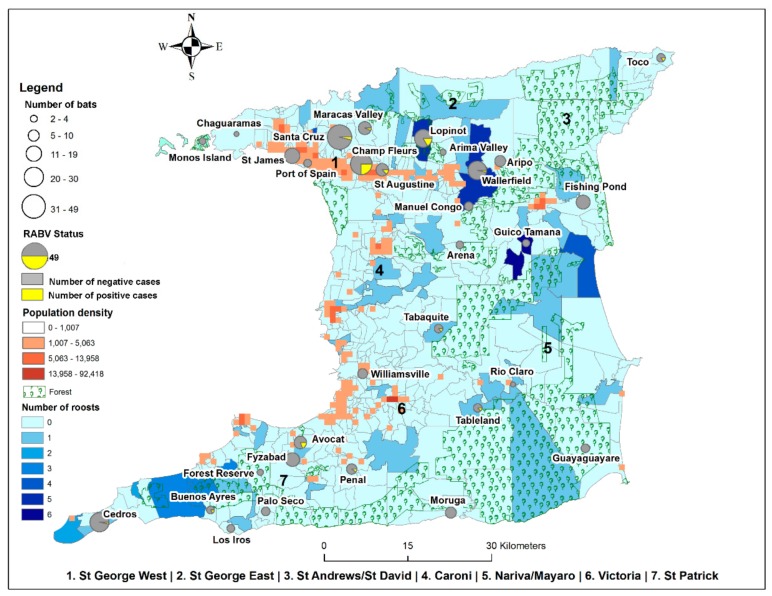
Figure 1.
Geographic locations of bat specimen collection in Trinidad relative to human population density, monitored vampire bat roosts and forested areas: numbers of bats collected per site indicated by the size of the circle with the number of RVNA positive (yellow) and negative (grey) samples indicated within each circle; urbanization level indicated by the human population density and; bat roost density indicated by the number of roosts.

