Figure 1.
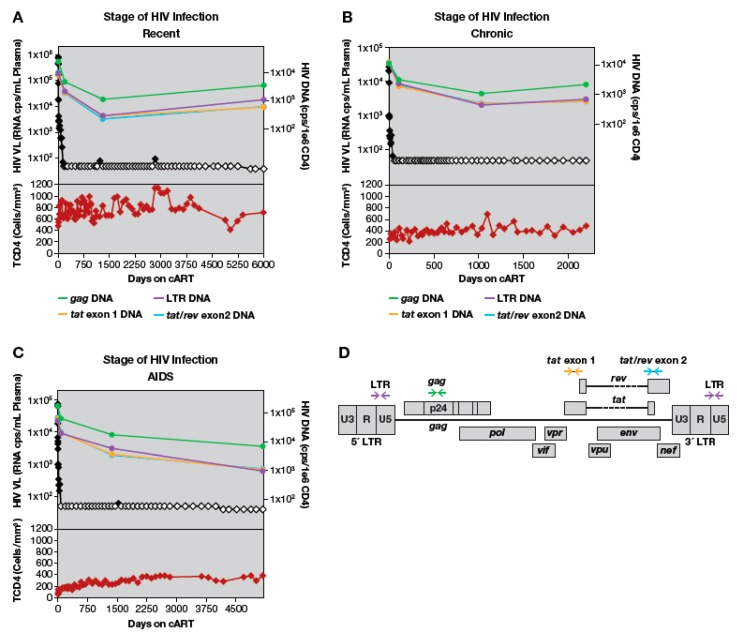
All HIV-1 DNA regions analyzed decline when combination antiretroviral therapy (cART) is initiated. HIV-1 DNA copies per 1 million CD4+ T-cells shown in green (long terminal repeat (LTR)), purple (gag), gold (tat exon 1), and blue (tat/rev exon 2). HIV viral load as HIV RNA copies per mL plasma is shown in black; open symbols represent values that are below the limit of detection. Total CD4 count in cells/mL shown in lower panel in red. Grey background represents periods of cART. (A) A participant treated during recent HIV infection AVBIO2_14. (B) A participant treated during chronic HIV infection, AVBIO2_17. (C) A participant treated during AIDS, AVBIO2_08. Error bars for copy numbers are omitted for clarity; as described in Methods, range in copy number was ≤2-fold in multiple determinations of each sample. (D). HIV-1 provirus map denoting positions of primers amplifying LTR, gag, tat exon1, and tat/rev exon2.

