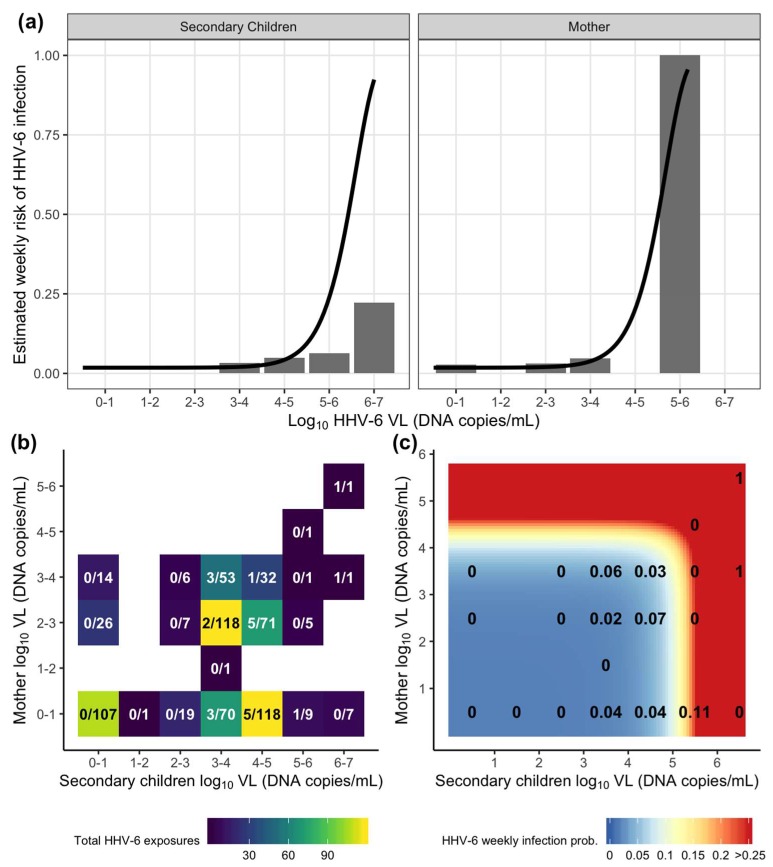
Figure 3.
Estimation of HHV-6 acquisition risk from exposures by week using the combined exposure model (Table 2 and Table A1). (a) Individual HHV-6 dose–response relationship for mother and secondary children oral viral load (VL, DNA copies/mL) exposures where bars depict the percentage of infections observed among total exposures in the data and lines depict estimated risk from the model. (b) A heatmap depicting the distribution of total combined exposures in a given viral load bin from mothers and secondary children in a household. The text depicts the fraction of total infections over total exposures. (c) A heatmap depicting the risk of HHV-6 infection from combined household mother and secondary children exposures estimated from the model. The text depicts the proportion of infections observed in the data using binned viral loads from (b) (equivalent to fraction displayed).

