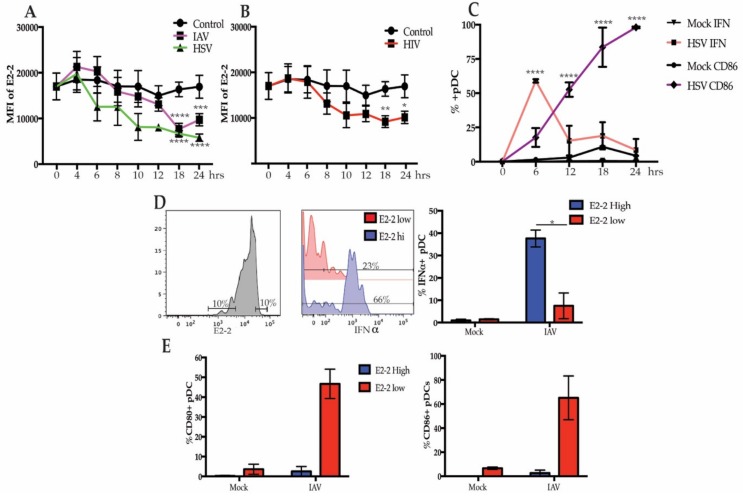
Figure 2.
E2-2 expression after viral stimulation is associated with functional and phenotype differences. (A,B) Expression of E2-2 in pDCs after PBMCs were stimulated with herpes simplex virus type 1 (HSV) or influenza A virus (IAV) at a multiplicity of infection (MOI) of 1 (A) or 500 ng p24 equivalents/mL of HIV-MN (B); n = 5 independent experiments. (C) pDCs stimulated with HSV for 0–24 h were measured for intracellular IFNα and CD86 expression by flow cytometry, n = 3 independent experiments. (D,E) Gating strategy to compare the 10% highest and lowest E2-2 expressing pDCs after stimulation with IAV for 24 h. Comparison of the percent IFNα+ cells (D) and CD80+ and CD86+ (E). (D,E), n = 4 independent experiments. Data are presented as means ± SEM. p values < 0.05 were considered significant. * p < 0.05, ** p < 0.01, *** p < 0.001, **** p < 0.0001.

