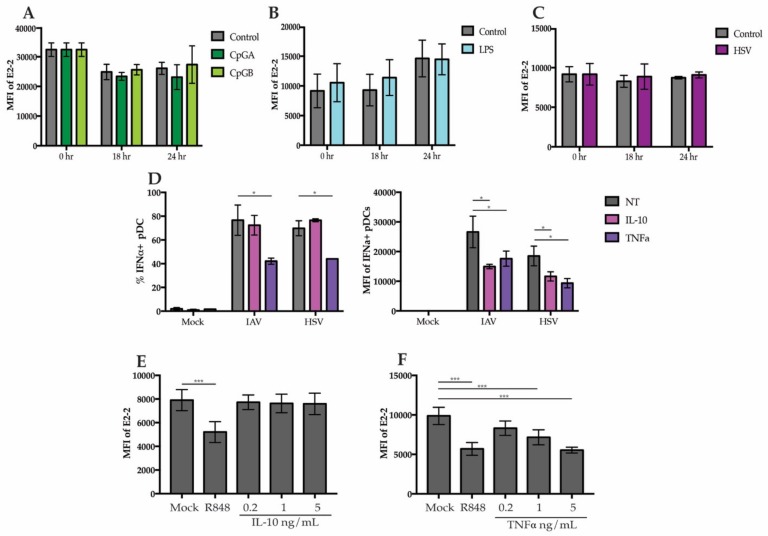
Figure 4.
E2-2 expression is mediated by a pDC extrinsic signal (A–C) pDCs enriched to a purity >90% were stimulated for 18 or 24 h with (A) 5 ug/mL CpGA or CpGB (B), 200 ng/mL LPS or (C), HSV. (D) PBMCs were cultured with 5 ng/mL of IL-10 or TNFα and stimulated with HSV or IAV. Intracellular IFNα production was measured at 6 h. (E,F) PBMCs were treated with either 10 µM R848, 0.2, 1, or 5 ng/mL IL-10 (E) or TNFα for 6 h then E2-2 expression was measured by flow cytometry. n = 3 independent experiments. Data are presented as means ± SEM. p values < 0.05 were considered significant. * p < 0.05, ** p < 0.01, *** p < 0.001.

