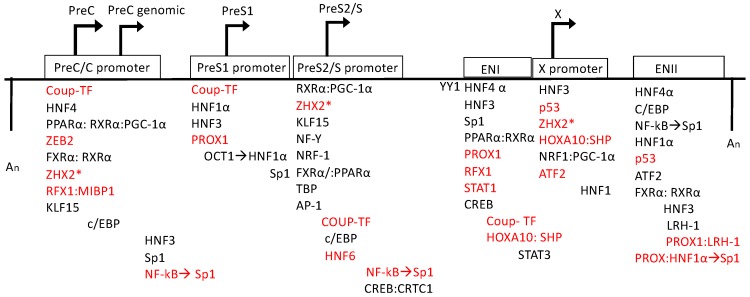
Figure 2.
Relative positions of the binding sites of host transcription factors on the HBV genome. Promoter and enhancer sites are represented by the boxes and the directional arrow indicates the transcript produced. The arrows from one transcription factor to another represents an event in which one factor influences the binding activity of another. The two An sites represent the polyadenylation sites in the linearized genome schematic. Transcription factor activity has been indicated in which red represents inhibition of HBV transcription and black indicates activation of transcription. The lists of transcription factors are positioned to represent where they bind to the genome where they are generally positioned to 5′ or 3′ of the promoter/enhancer region (not to scale). Asterisks indicate that the specific positioning of the transcription factor is not yet known.

