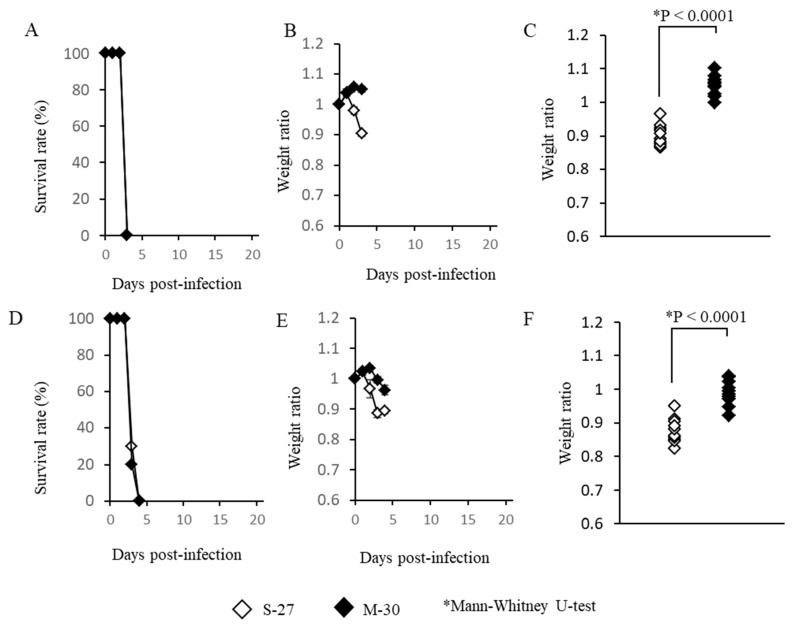
Figure 2.
Survival rates (A,D), average ratios of weight change (B,E) and individual weights when the mice died (C,F) of AG129 mice following subcutaneous infection with high titer 105 PFU (A–C) and low titer 102 PFU (D–F) of M-30 and S-27 CHIKV strains. The error bars represent the standard deviations. The asterisks show significant differences by the Mann–Whitney U-test, P < 0.05.

