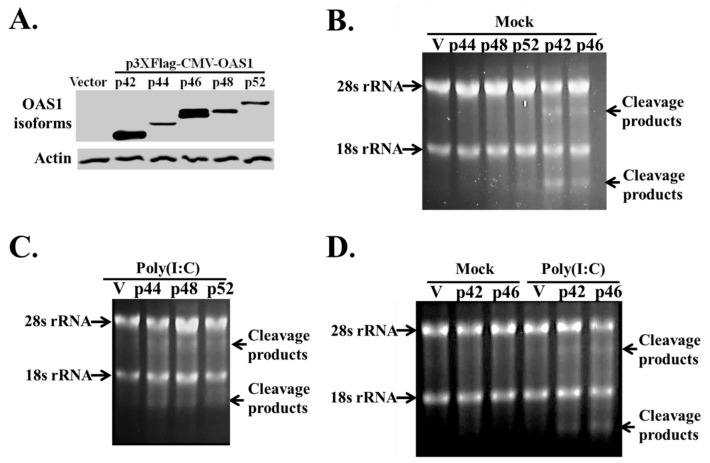
Figure 3.
Analysis of RNase L cleavage in cells overexpressing individual hOAS1 isoforms in response to poly(I:C). HEK293 cells were transfected with 1 µg of empty vector DNA, or of one of the hOAS1 isoforms cloned into the p3xFlag-CMV plasmid for 24 h. (A) Western blot analysis of the expression level of each OAS1 isoform, using anti-Flag and anti-β actin antibodies. HEK293 cells overexpressing each OAS1 isoform (1 µg of plasmid DNA) for 24 h were either mock transfected (B), or transfected with poly(I:C) for 6 h (C). Total intracellular RNA was extracted and separated on a denaturing agarose gel and stained with ethidium bromide. (D) HEK293 cells were transfected with 0.5 µg p42 or p46 plasmid DNA for 9 h, followed by either mock transfection, or transfection with poly(I:C) for 6 h. Total intracellular RNA was extracted and separated on a denaturing agarose gel and stained with ethidium bromide. The 18S/28S rRNA and their cleavage products are indicated by arrows. V: empty vector control.

