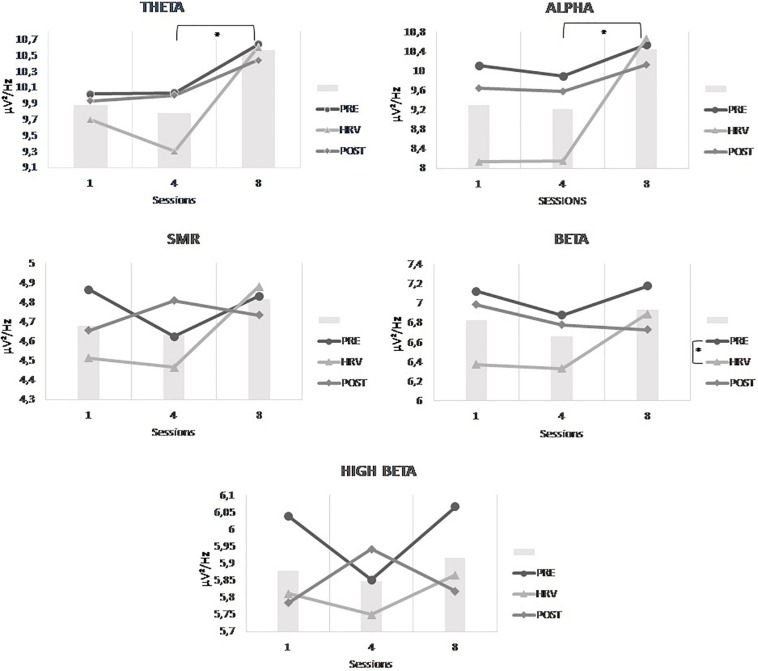
FIGURE 6.
Mean power densities of the untrained EEG frequency bands (i.e., theta, alpha, SMR, beta, and high beta) across conditions (i.e., pre, HRV and post) within a session and across sessions (i.e., session 1, session 4, and session 8) for the HRV group. The bar graphs represent the mean power densities of the untrained EEG frequency bands across sessions, independently of the conditions. Significant main effects are highlighted on the respective graphs.

