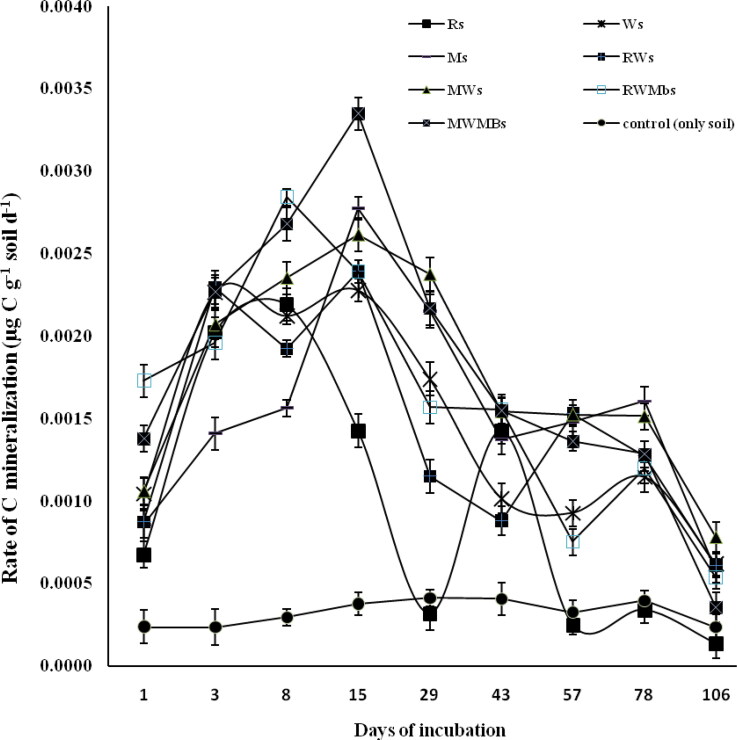
Figure 4.
Changes in rate of carbon mineralization (µg C g−1 soil) on different days under different residues surface-applied to the soil. Vertical bars indicate ± standard error of the mean of the observed values.Ri: Rice, incorporated into the soils. Wi: Wheat, incorporated into the soils. Mi: Maize, incorporated into the soils. RWi: Rice + wheat, incorporated into the soils. MWi: Maize + wheat, incorporated into the soils. RWMbi: Rice + wheat + mungbean, incorporated into the soils. MWMbi: Maize + wheat + mungbean incorporated into the soils. Control: only soil.

