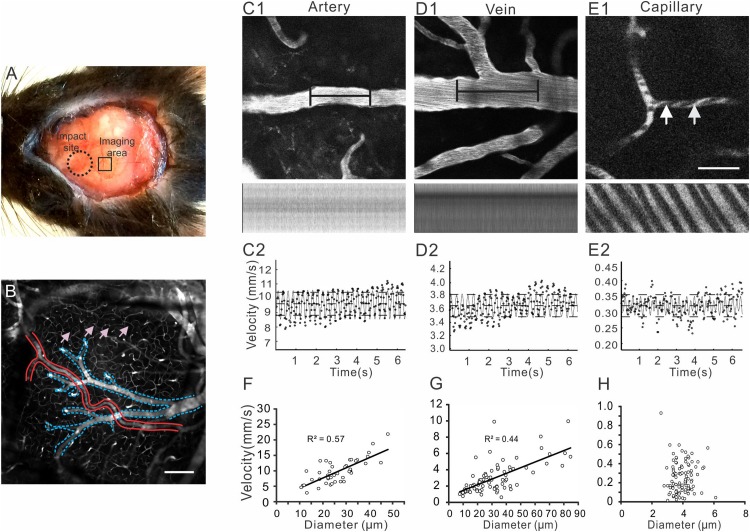
FIGURE 1.
In vivo two-photon microscopy for imaging cerebral vasculature and measuring blood flow through a thinned-skull window. (A) The skull above left parietal cortex of a mouse was thinned and strengthened by gluing a piece of square coverglass (∼ 1.5 × 1.5 mm) for in vivo imaging (small square). Closed-head mTBI was induced by using a controlled cortical impact (CCI) device with a 3 mm diameter tip to strike on an area that was about 1 mm rostral to the anterior edge of the imaging window (large dotted circle). (B) A representative image of Z series projection of cerebral vessels reveals arteries (delineated in red), veins (delineated in blue), and networks of capillaries (pink arrows). (C–E) A segment of arteriole (C1), venule (D1), or capillary (E1) was oriented in a horizontal direction (top row) and imaged in line scan mode at 1 ms/line, which generated dark stripes (second row). The measurements were obtained from a single vessel. Velocity of red blood cells (RBC) in each vessel was calculated based on the line scan using a Matlab script (C2–E2); the resulting velocities at different moments (small dots in C2–E2) were fitted to a second-order Fourier series (oscillating solid lines); the dashed horizontal lines represented time-averaged velocities. (F–H) Analyses of the relationships between RBC velocities and vessel diameters revealed positive correlations in arterioles and venules (F,G), but not in capillaries (H). Scale bars in B and E1 for C1-E1: 50 μm.

