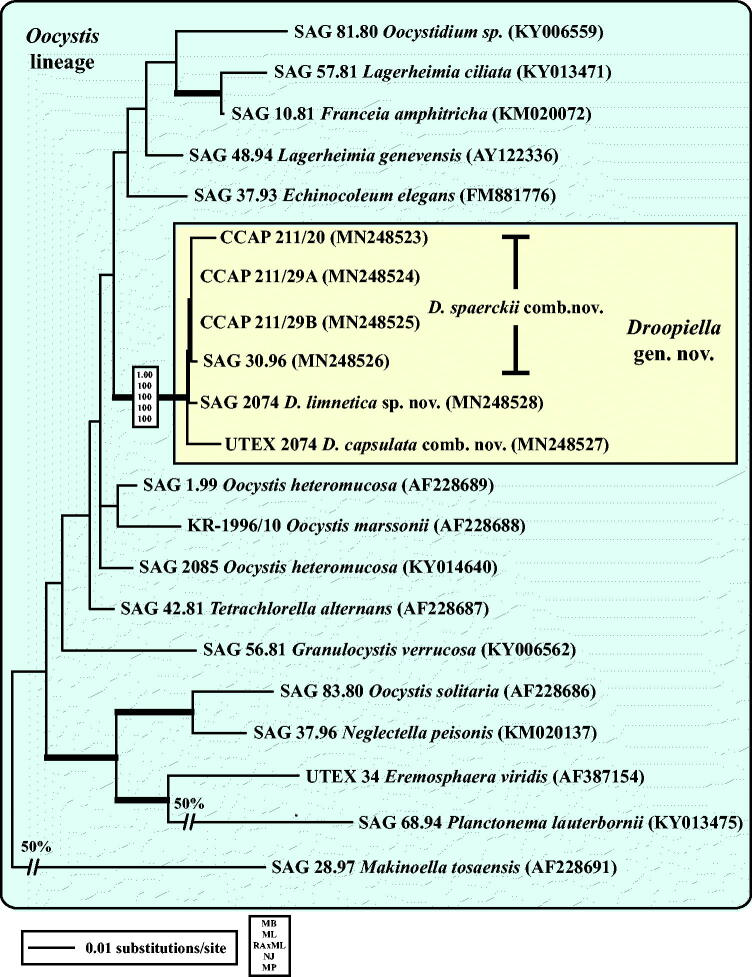
Fig. 3.
Molecular phylogeny of the Oocystis lineage (Trebouxiophyceae) based on SSU rDNA sequence comparisons. The phylogenetic tree shown was inferred using the Maximum likelihood method based on the data sets (1778 aligned positions of 23 taxa) using PAUP 4.0b10. For the analyses, the best model was calculated by Modeltest 3.7. The setting of the best model was given as follows: TrN + I + G (base frequencies: A 0.2498, C 0.2263, G 0.2752, T 0.2487; rate matrix A-C 1.0000, A-G 1.5365, A-U 1.0000, C-G 1.0000, C-U 4.1953, G-U 1.0000) with the proportion of invariable sites (I = 0.5925) and gamma shape parameter (G = 0.6827). The branches in bold are highly supported in all analyses (Bayesian values > 0.95 calculated with MrBayes; bootstrap values > 70% calculated with PAUP using Maximum likelihood, Neighbour-joining, Maximum parsimony and RAxML using Maximum likelihood).

