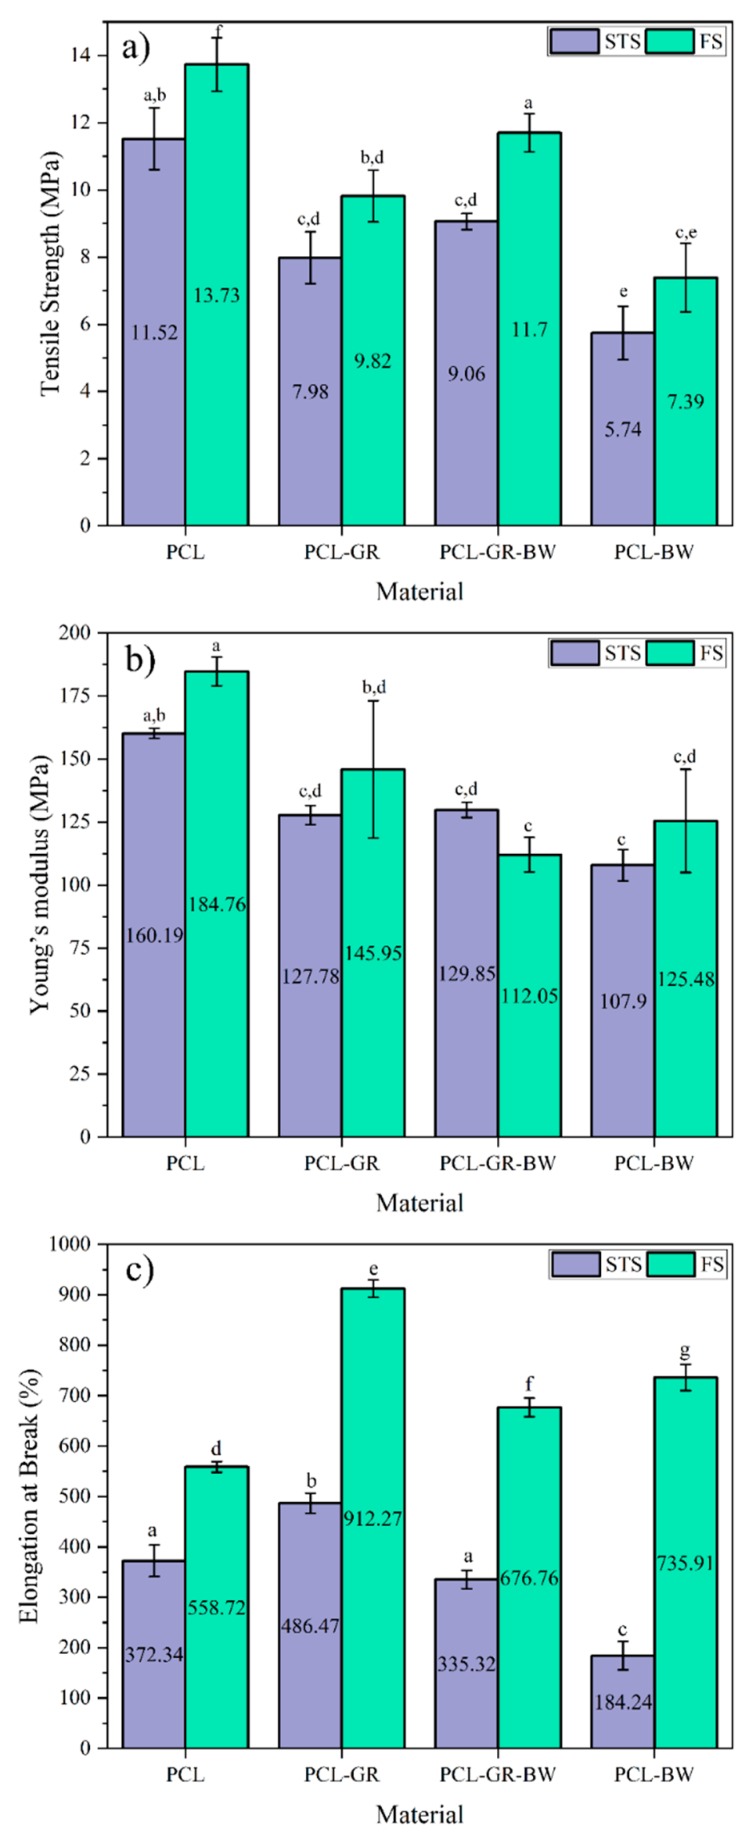
Figure 5.
Comparison of (a) tensile strength, (b) Young’s Modulus, and (c) elongation at Break of STS (standard test specimen) and FS (filament samples) of neat PCL and the formulations with GR and BW filaments. a–g Different letters within the same property show statistically significant differences between formulations (p < 0.05).

