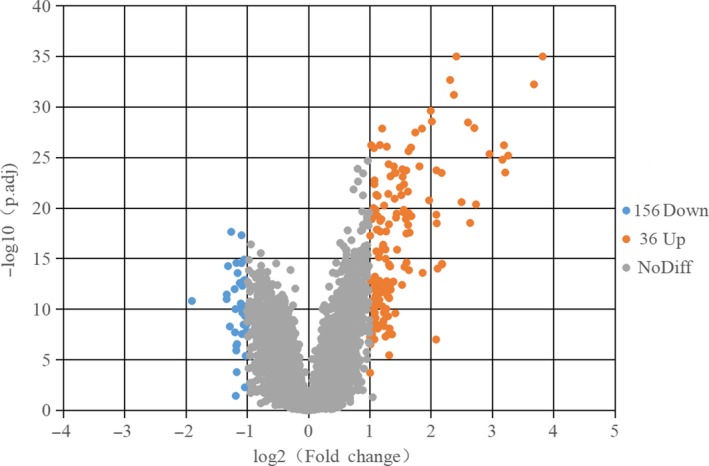
Figure 1.

Differentially expressed genes in PTB and HC samples were shown in the volcano plot, with blue dots representing significantly down‐regulated genes in PTB samples and orange dots representing significantly up‐regulated genes. HC, healthy control; PT, pulmonary tuberculosis
