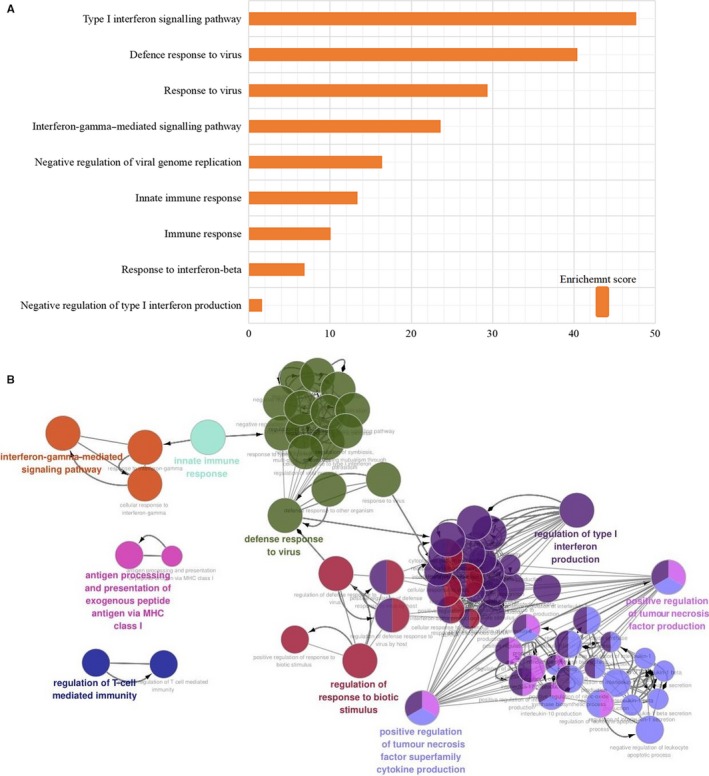
Figure 3.

A, Top 9 biological processes were selected and shown in bar chart according to enrichment score. B, Use ClueGO to analyse the interaction networks of enriched biological processes, and multiple colour dots indicate that it revolved in multiple biological processes
