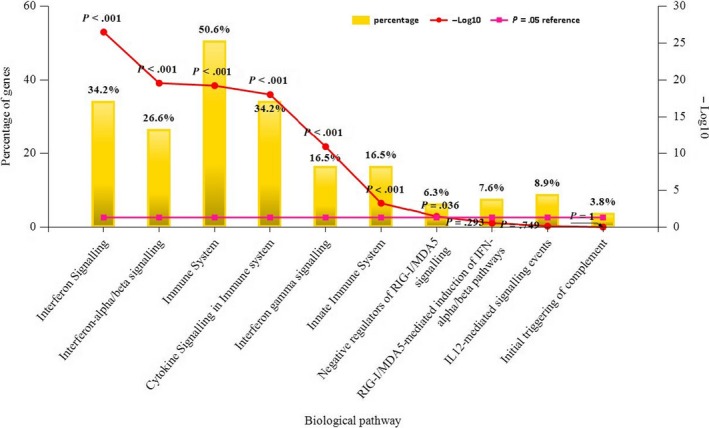
Figure 4.

The Funrich software drew a bar chart of 10 biological pathways based on the P‐value and the percentage of genes, among which biological pathways with P‐value < .05 are statistically significant. The results showed that the biological pathways with significantly enriched were immune system–related
