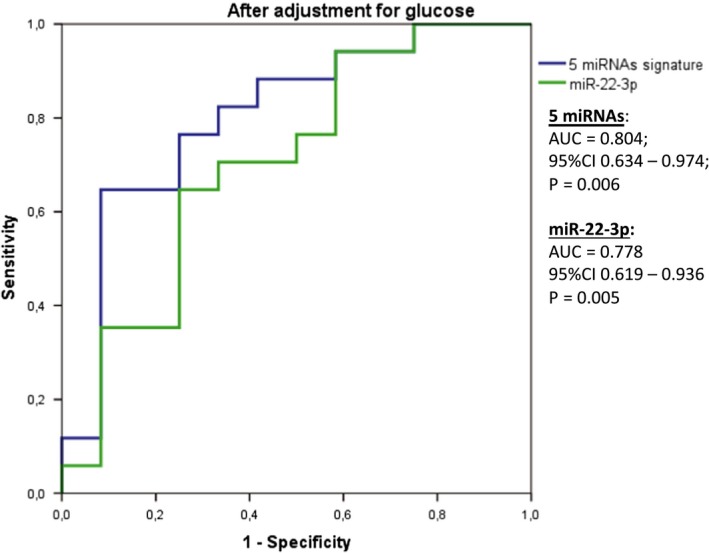
Figure 2.

ROC curve to discriminate responders and non‐responders to diet 2 using 7 miRNAs (miR‐130a‐3p, miR‐142‐5p, miR‐144‐5p, miR‐15a‐5p, miR‐22‐3p, miR‐221‐3p and miR‐29c‐3p) and only miR‐22‐3p

ROC curve to discriminate responders and non‐responders to diet 2 using 7 miRNAs (miR‐130a‐3p, miR‐142‐5p, miR‐144‐5p, miR‐15a‐5p, miR‐22‐3p, miR‐221‐3p and miR‐29c‐3p) and only miR‐22‐3p