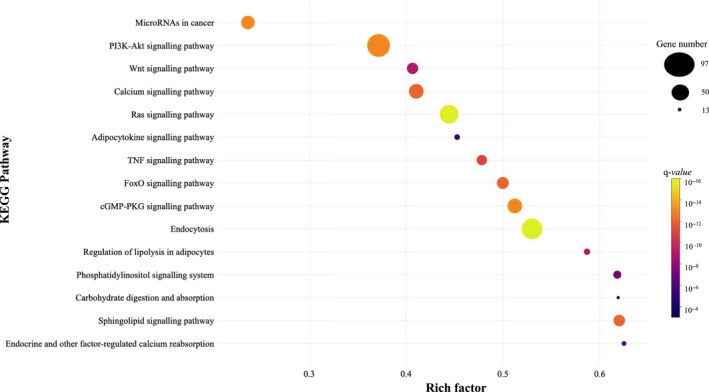
Figure 4.

Significant KEGG pathways related to metabolism and potentially regulated by the seven miRNAs differentially expressed between responders and non‐responders to a low‐fat diet. The rich factor is the ratio of miRNAs target genes to the total gene number annotated in a certain pathway. The greater the rich factor, the greater the degree of pathway enrichment. The size and the colour of the dots represent the gene number and the range of the pathway's q‐value, respectively. Q‐values: P values corrected for multiple tests using the Benjamini‐Hochberg procedure. miRNA: microRNA
