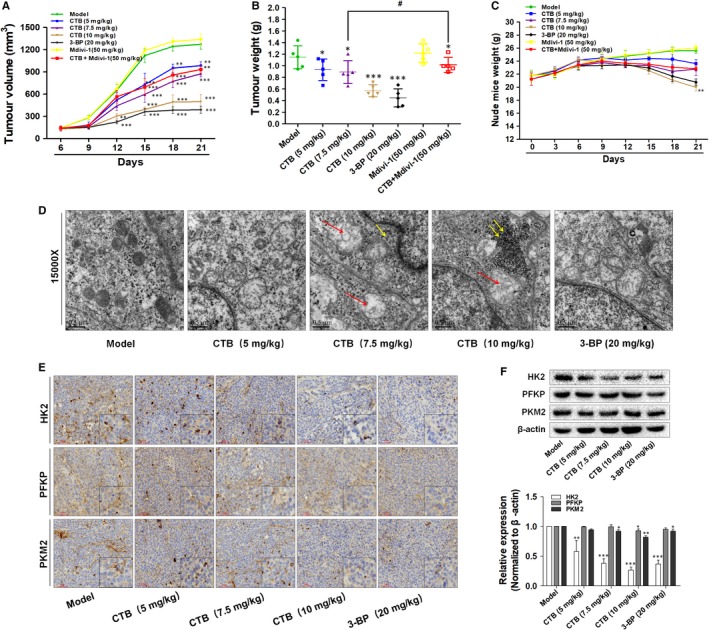
Figure 7.

CTB inhibits the growth of HCC xenograft tumour in vivo. Nude mice with HCC cells xenograft were randomly divided into groups when tumour volume reached 150 mm3. (A) Tumour volumes were measured every three days and calculated using the formula: length × width2 × 0.5. (B) Tumour weights comparison, obtained on the final day of sacrifice in mice. (C) Body weights were recorded every three days. (D) Observation of tissues by transmission electron microscopy. swollen mitochondria (red arrow); accumulation of glycogen (yellow arrow). Scale bar: 0.5 μm. (E) Tumour tissues were subjected to immunohistochemistry staining with indicated antibodies to detect the change of HK2, PFKP and PKM2. Scale bar: 50 μm. (F) Western blot analysis showed the protein expression of HK2, PFKP and PKM2. Data were presented as mean ± SD (n = 8); significance: *P < .05, **P < .01 and ***P < .001 vs model; # P < .05, ## P < .01 and ### P < .001 vs CTB treatment
