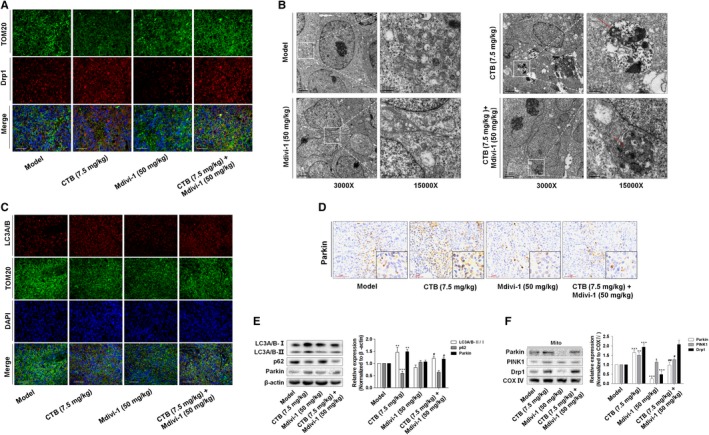
Figure 8.

CTB‐regulated mitochondrial fission was closely related to the mitophagy in vivo. (A) Image of mitochondria and Drp1 colocalization were viewed with fluorescence microscope (Blue: DAPI; Green: TOM20; Red: Drp1). Scale bar: 100 μm. (B) Observation of mitophagy by transmission electron microscopy. Autophagosome (red arrow). Scale bar: 0.5 or 2 μm. (C) The detection of LC3A/B activation by fluorescence microscopy (Blue: DAPI; Green: TOM20; Red: LC3A/B). Scale bar: 100 μm. (D) Immunohistochemical analysis of Parkin in tumour tissues. Scale bar: 50 μm. (E) Western blot analysis showed the protein expression of LC3A/B, p62 and Parkin. (F) Western blot analysis showed the protein expression of Drp1, Parkin and PINK1 in mitochondrial debris of tumour tissue. Data were presented as mean ± SD (n = 8); significance: *P < .05, **P < .01 and ***P < .001 vs model; # P < .05, ## P < .01 and ### P < .001 vs CTB treatment
