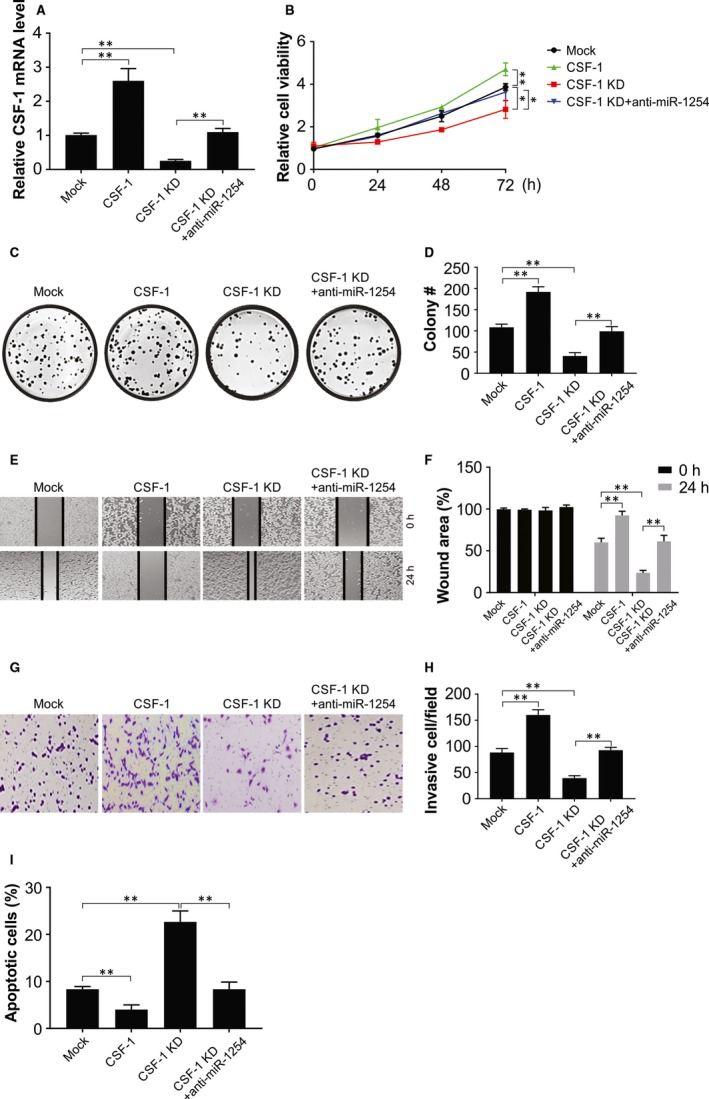
Figure 5.

CSF‐1 promoted the proliferation, colony formation, migration and invasion of glioma. (A) U87 cells of CSF‐1 overexpression and knockdown were analysed by real‐time PCR. (B) CCK‐8 assay showed that cell viability was significantly stronger in CSF‐1 overexpression group while was weaker in CSF‐1 knockdown group, and there was no significant difference between CSF‐1‐KD + anti‐miR‐1254 group and mock group. (C) and (D) Colony formation assay showed that colony number in CSF‐1 overexpression group was remarkably higher, whereas that in CSF‐1 knockdown group was much lower, and there was no significant difference between CSF‐1‐KD + anti‐miR‐1254 group and mock group. (E) and (F) Wound‐healing assay showed that cell migration rate in CSF‐1 overexpression group was remarkably higher, whereas that in CSF‐1 knockdown group was much lower, and there was no significant difference between CSF‐1‐KD + anti‐miR‐1254 group and mock group. (G) and (H) More invaded cells were observed in CSF‐1 overexpression group while the number of invaded cells in CSF‐1 knockdown group was significantly lower compared with the mock group, and there was no significant difference between CSF‐1‐KD + anti‐miR‐1254 group and mock group. (I) Cell apoptosis rate was notably higher in CSF‐1 knockdown group while lower in CSF‐1 overexpression group, and there was no significant difference between CSF‐1‐KD + anti‐miR‐1254 group and mock group. Results were expressed as means ± SD of three independent experiments. *P < .05; **P < .01
