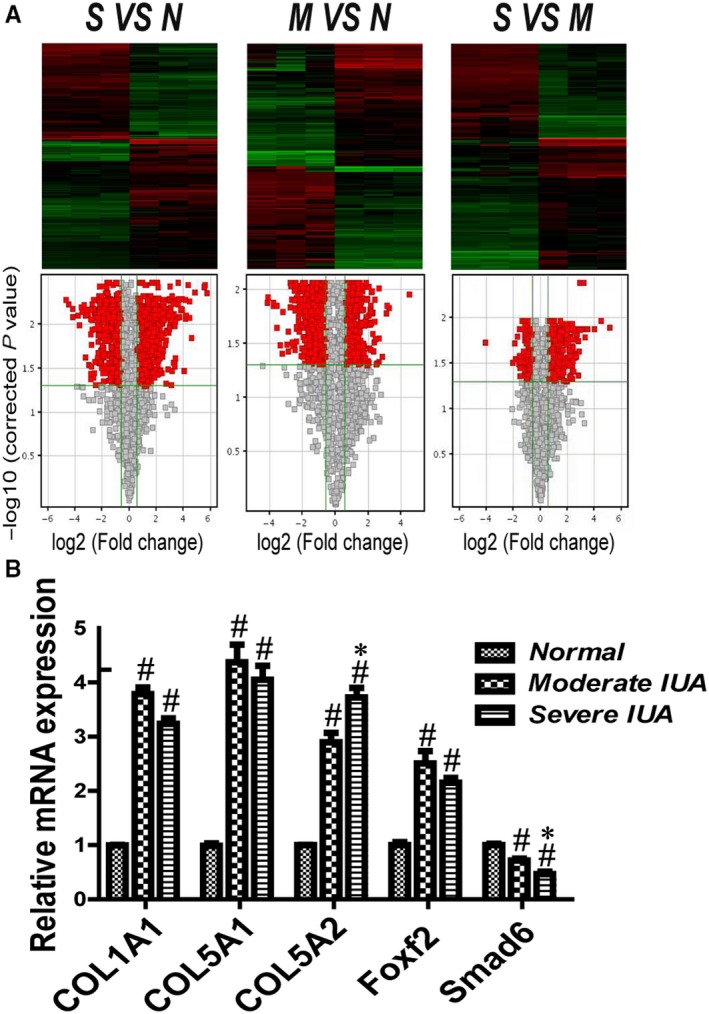
Figure 1.

Microarray sequencing for gene expression profiles of endometrial specimen (n = 5). (A) Heat map and Volcano plot representation of tissue microarray sequencing for gene expression profiles of IUA and normal control. Abbreviations: M, moderate IUA group; N, normal group; S, severe IUA group. (B) The relative mRNA expression of COL1A1, COL5A1, COL5A2, Foxf2 and Smad6 in each group. # P < .05, compared with normal group. *P < .05, compared with moderate IUA group
