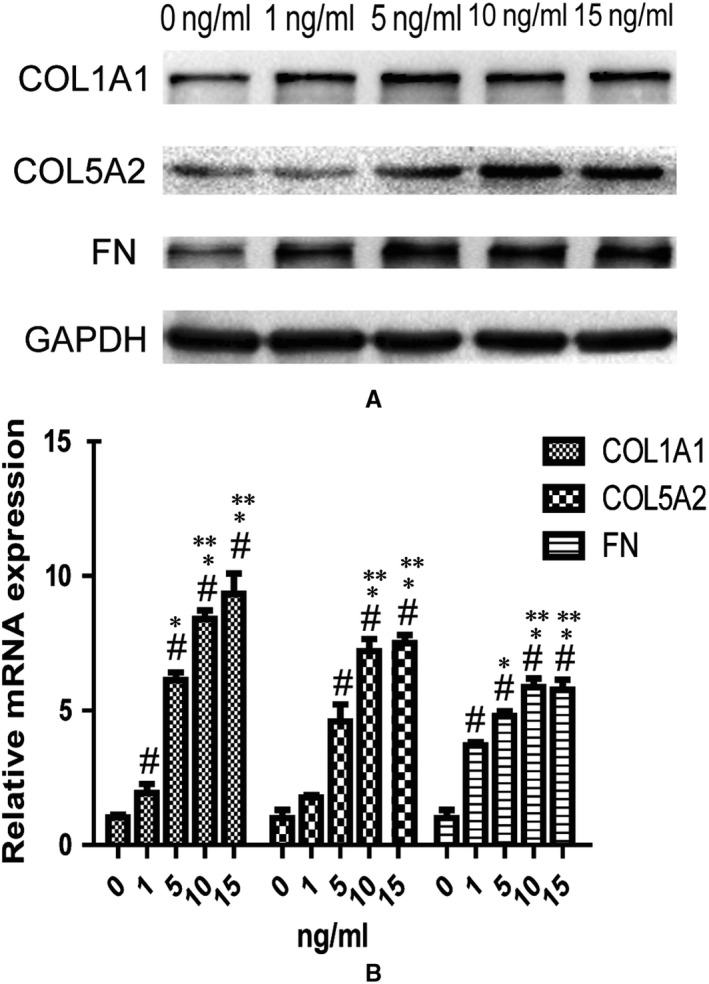
Figure 2.

Human endometrial stromal cell lines (HESCs) were treated with TGF‐β1 (0, 1, 5, 10, 15 ng/mL) to select an optimal dosage to create a cell fibrosis model (n = 3). (A) Western blotting analysis of COL1A1, COL5A2 and FN in different concentration groups of TGF‐β1. (B) qRT‐PCR analysis of the mRNA expressions of COL1A1, COL5A2 and FN in different concentration groups of TGF‐β1. # P < .05, compared with control group (0 ng/mL). *P < .05, compared with 1 ng/mL group. **P < .05, compared with 5 ng/mL group
