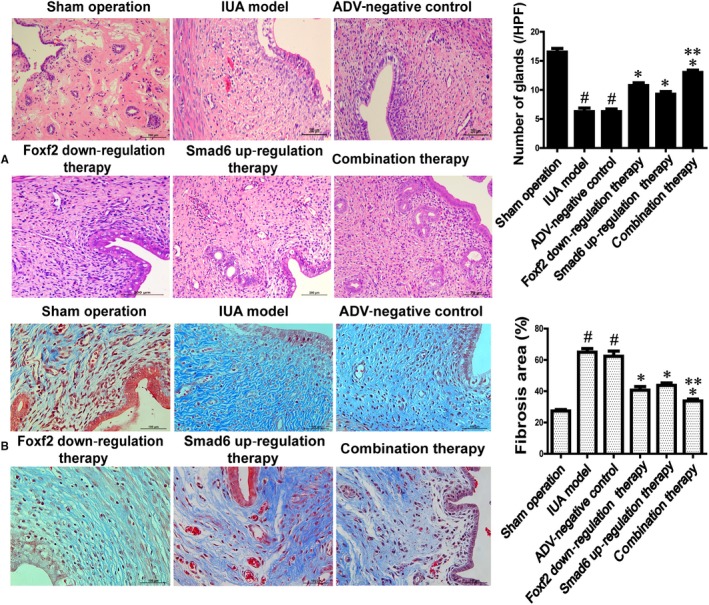
Figure 7.

The effect of Foxf2 down‐regulation or (and) Smad6 up‐regulation on anti‐fibrosis in rat IUA model (n = 10). (A) HE staining analysis of the number of glands in rat endometrium in each group. # P < .05, compared with sham operation group. * P < .05, compared IUA model and ADV‐negative control group. ** P < .05, compared with Smad6 up‐regulation therapy group. (B) Masson staining of analysis of the percentage of fibrosis area in each group. # P < .05, compared with sham operation group. * P < .05, compared with IUA model and ADV‐negative control group. ** P < .05, compared with Smad6 up‐regulation therapy group
