
Figure 2.
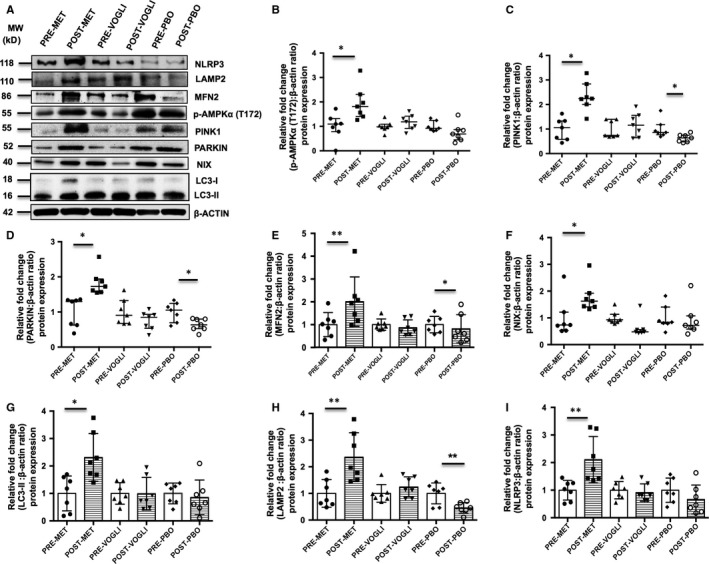
A, Representative Western blots of NLRP3, p‐AMPKα (T172) and mitophagy‐related proteins; β‐actin was used as a loading control. Quantification of protein expression of (B) p‐AMPKα (T172), (C) PINK1, (D) PARKIN, (E) MFN2, (F) NIX, (G) LC3‐II, (H) LAMP2 and (I) NLRP3, in NDT2DM patients at baseline and following treatment with metformin, voglibose and placebo, respectively. All the values of the baseline groups were set to 1, and the expression levels for the treatment groups were derived relative to their corresponding controls (baseline), and the values have been expressed in fold change. Scatter plot displays values in median and interquartile range, while scatter plot with bar diagram represents the values in Mean ± SD (n = 7 each). *P < .05; **P < .01, P‐values were calculated using Paired t test or Wilcoxon signed‐rank test