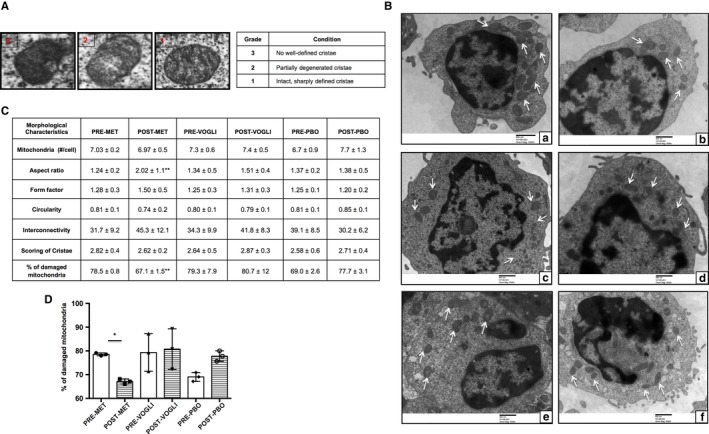
Figure 3.

A, Images representing the scoring system ranging from 1 (best) to 3 (worst), depending upon the cristae appearance. B, Representative electron micrographs showing mitochondria (white arrows) observed in (a & b) pre– and post–metformin‐treated patients, (c & d) pre– and post–voglibose‐treated patients and (e & f) pre– and post–placebo‐treated patients. Scale bars are indicated. Original magnification: A to E, 5000×, (C). Table depicting the mitochondrial morphological characteristics and (D) scatter plot with bar diagram displaying the percentage of damaged mitochondria in patients with NDT2DM at baseline and post‐follow‐up. Values are expressed in Mean ± SD (n = 3 each group). *P < .05 vs baseline
