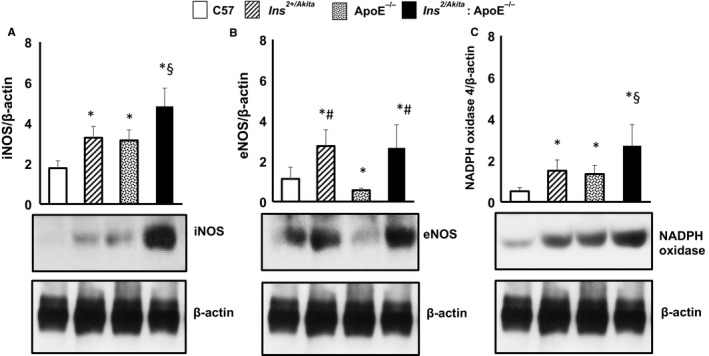
Figure 4.

Expression of iNOS, eNOS and NADPH oxidase. Western analysis of (A) iNOS, (B) eNOS and (C) NADPH oxidase expression in aortas from Ins2Akita, ApoE−/− and Ins2Akita: ApoE−/− mice and from sex‐ and age‐matched (3 months old) C57BL/6 non‐diabetic control mice, with β‐actin serving as a loading control. The bar graph represents for each value the mean ± SD from three separate experiments. *P < .05 vs C57BL/6 control mice; #P < .05 vs ApoE−/− mice; §P < .05 vs Ins2Akita mice and ApoE−/− mice; N = 8 mice/group
