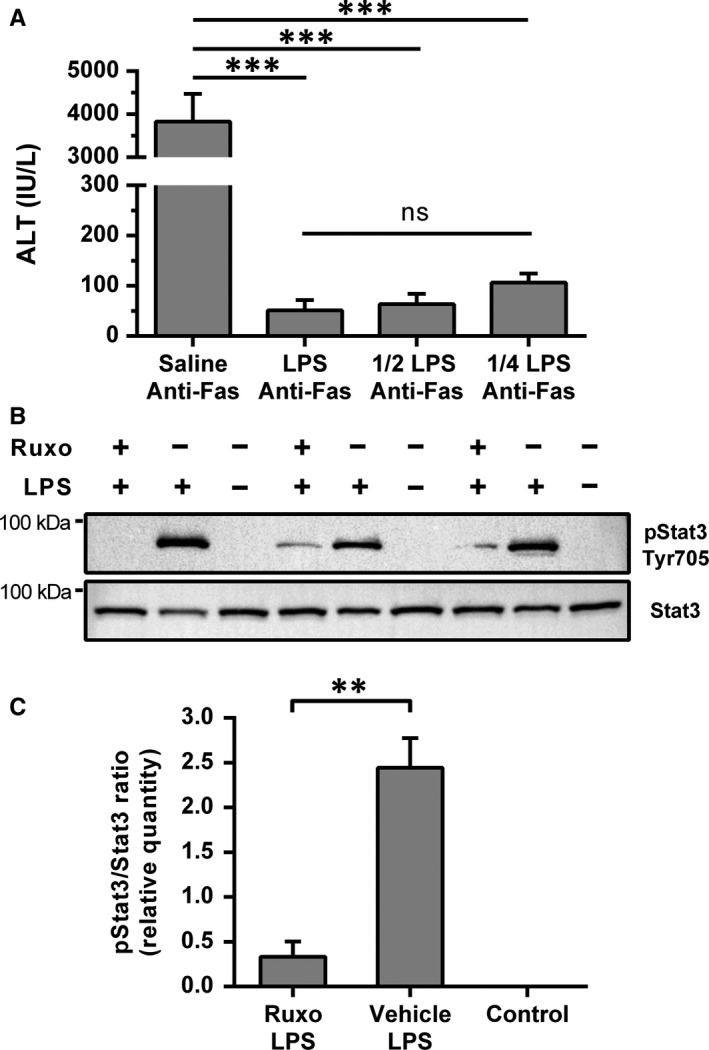
Figure 5.

Ruxolitinib pre‐treatment inhibited LPS‐induced Stat3 phosphorylation in the liver. A, Dose effect of LPS treatment on anti‐Fas antibody induced apoptosis. Mice were treated with saline or LPS in three different doses: 0.1 mg/kg, 0.05 mg/kg and 0.025 mg/kg, followed by anti‐Fas antibody (JO2, 0.25 mg/kg) after 2 h. Sera were collected after 6 h, and ALT levels were analysed (n = 3‐4 per group). LPS = 0.1 mg/kg, 1/2 LPS = 0.05 mg/kg and 1/4 LPS = 0.025 mg/kg. Columns and bars represent mean ± SEM. ANOVA was used for analysis. B, Western blot analysis of pStat3 and Stat3 expressions in liver tissue. Mice were treated with ruxolitinib (180 mg/kg) or vehicle (DMSO + PEG300 + dH2O) followed by LPS (0.025 mg/kg) treatment 2 h after, and liver samples were collected 90 min after LPS treatment. The control group was treated with vehicle and saline. C, Analysis of pStat3 and Stat3 signal intensities, normalized to total protein signal intensity. Image Lab Software (Bio‐Rad) was utilized for signal intensity quantification and normalization. Columns and bars represent mean ± SEM of the pStat3/Stat3 signal intensity ratio, and Student's t test was used for the analysis (n = 3 per group). The stain‐free gels and the accompanying blotting membranes are shown in the Supporting information (Figure S4). **P < .01, ***P < .001, ns—not significant. (p)Stat3, (phosphorylated) signal transducer and activator of transcription 3; ALT, alanine aminotransferase; dH2O, distilled water; DMSO, dimethyl sulfoxide; LPS, lipopolysaccharide; PEG300, polyethylene glycol 300; Ruxo, ruxolitinib
