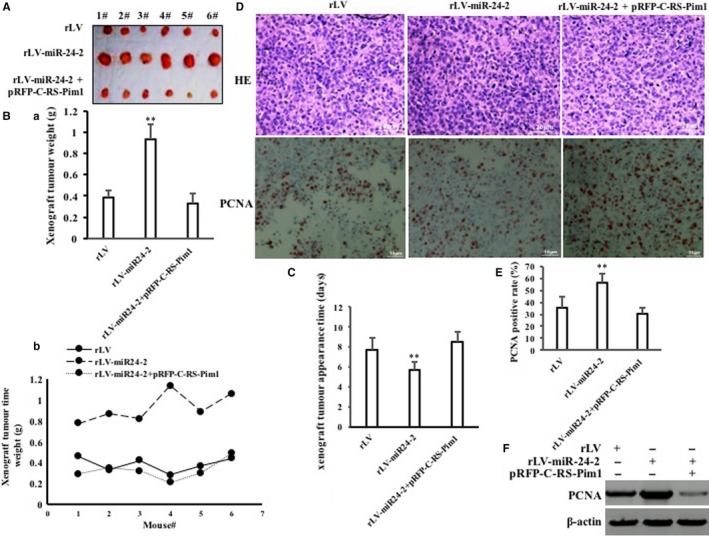
Figure 11.

The rescued test for Pim1 in three stable Hep3B cell lines, including rLV group, rLV‐miR24‐2 group and rLV‐miR24‐2 plus pRFP‐C‐RS‐Pim1 group, respectively. A, The pictures of xenograft tumours from Balb/C nude mouse. B, (a‐b) The weight of xenograft tumours from Balb/C nude mouse. C, The appearance time of the xenograft tumours. Each value was presented as mean ± standard error of the mean (SEM) (Student's t test). Bar ± SEM. **P < .01; *P < .05. D, Haematoxylin‐eosin (HE) staining and anti‐PCNA staining of xenograft tumours (original magnification ×100). PCNA. E, The analysis of positive rate (%) of PCNA. F, The Western blotting analysis with anti‐PCNA. β‐Actin as internal control
