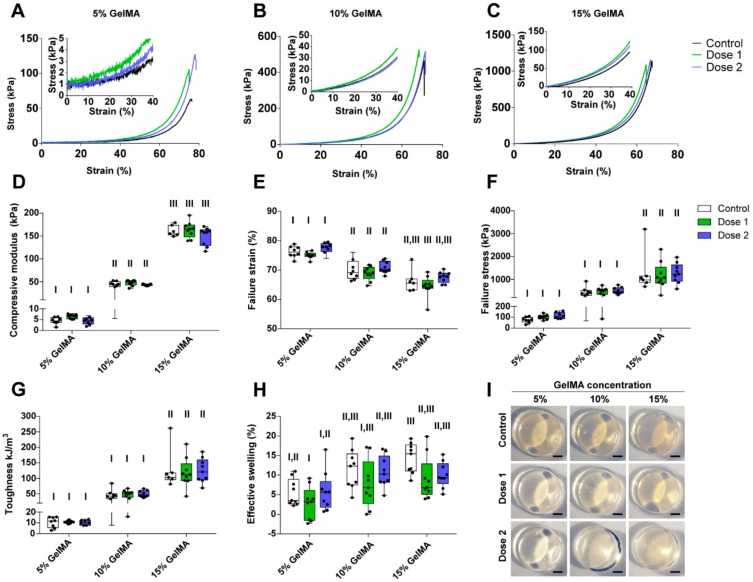
Figure 2.
Characterization of the compressive and swelling properties of GelMA-DDS hydrogels for various GelMA concentrations and doses of Abraxane®. (A–C) Representative stress-strain curves for 5% w/v (A), 10% w/v (B) and 15% w/v (C) GelMA groups. (D) Compressive modulus. (E) Failure strain. (F) Failure stress. (G) Toughness. (H) Effective swelling. (I) Representative images of hydrogel samples; scale bar = 1 mm. Dose 1 and 2 refer to 37.5 µg and 75 µg Abraxane®, respectively. Control refers to no drug loading. Data are shown as box plots, n = 9. Groups with no statistical difference are marked with the same roman numeral.

