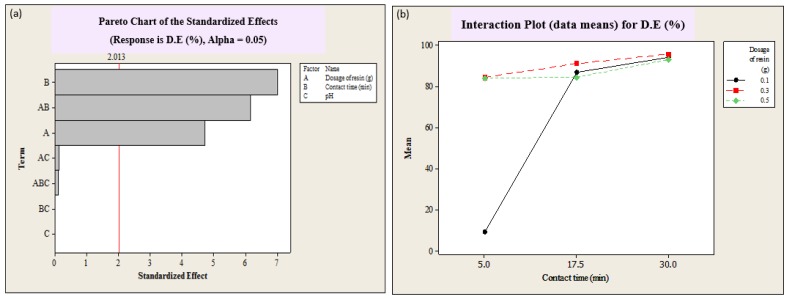
Figure 2.
Pareto chart showing the effects and interactions of operational variables, namely dosage of resin (g), contact time (min) and pH, on the decolorization efficiency (D.E. (%)) by SIR (a), and interaction plot of decolorization efficiency (D.E. (%)) by SIR versus contact time (min) for the different dosages of resin, namely 0.1, 0.2, and 0.3 g of SIR (b).

