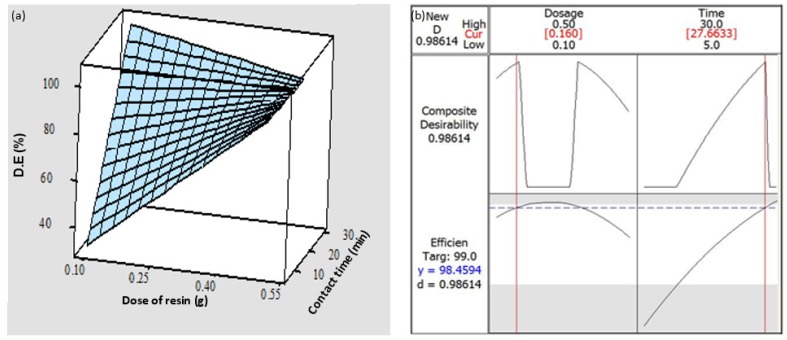
Figure 3.
Surface plot showing the decolorization efficiency (D.E. (%)) as a function of the dosage of resin (g) and contact time (min) under a shaking speed of 230 rpm and pH 3.6 (a), and optimization plot for the determination of the optimum conditions, namely dosage of resin (g) and contact time (min), for a maximum decolorization efficiency (D.E. (%)) by SIR (b).

