Figure 7.
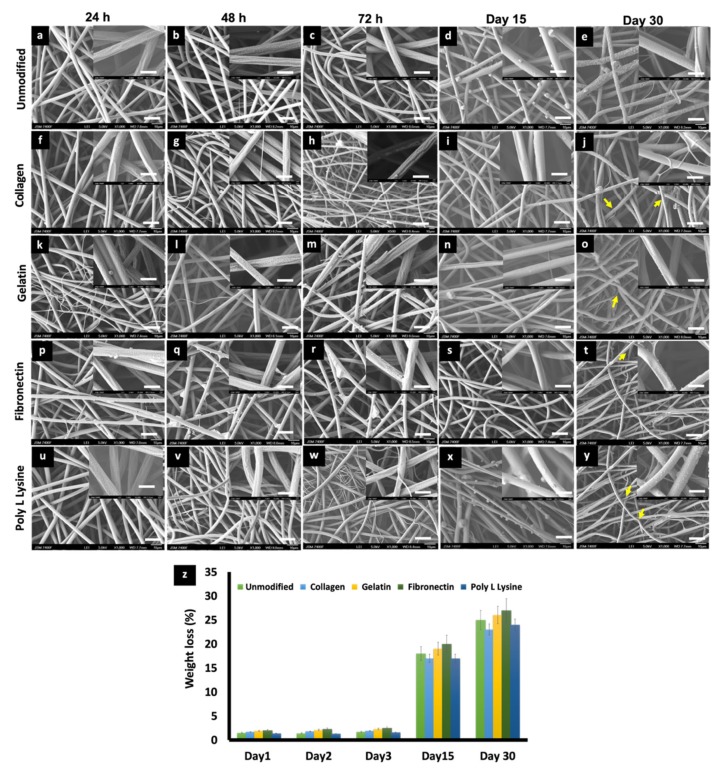
SEM micrographs depicting the changes in morphology of (a) 24 h, (b) 48 h, (c) 72 h, (d) Day 15, (e) Day 30 PLLA unmodified, (f) 24 h, (g) 48 h, (h) 72 h, (i) Day 15, (j) Day 30, PLLA collagen, (k) 24 h, (l) 48 h, (m) 72 h, (n) Day 15, (o) Day 30, PLLA gelatin, (p) 24 h, (q) 48 h, (r) 72 h, (s) Day 15, (t) Day 30, PLLA fibronectin and (u) 24 h, (v) 48 h, (w) 72 h, (x) Day 15, (y) Day 30. PLLA poly L lysine electrospun scaffolds after being immersed in PBS 7.4 for different time point at 37 °C at Day 0, Day 2, Day 3, Day 15, Day 30. (scale bar = 10 µm). Inset images are magnifications of the corresponding surface (scale bar = 1 µm). Salt crystal accumulation on the fiber surface can be observed along with the thinning of fibers due to gradual degradation after 30 days of incubation in PBS. (indicated by yellow arrows) (z) Weight loss percentage of electrospun PLLA and different protein functionalized scaffolds during 30 days of degradation in phosphate buffer saline (PBS).

