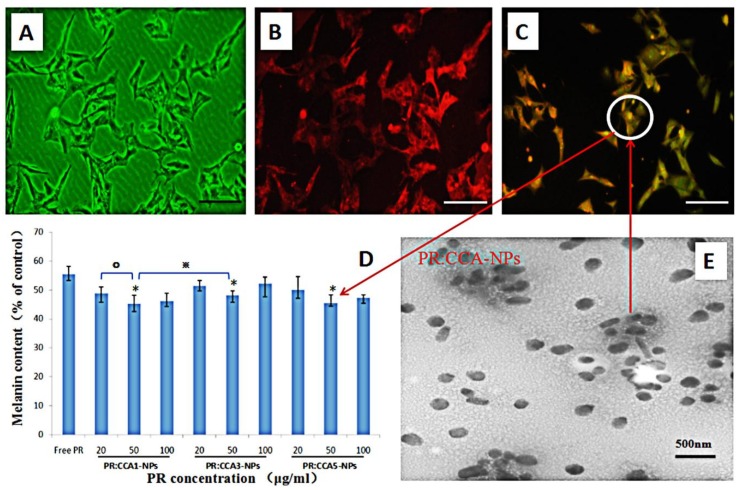
Figure 6.
(A–C) The FITC labled PR:CCA-NPs were added to B16 cells and co-incubated for 4h to detect the effects of PR: CCA-NPs on pinocytosis by cells, the scale bar represents 25 μm. (A) Control group, (B) DiD labeled cell membrane, (C) FITC labeled PR:CCA-NPs; (D) Effects of different NPs with different concentration on cellular melanin content in B16 cells; E: TEM of PR: CCA5-NPs. Note: * p < 0.05: CCA-NPs (50 μg/mL) vs Free PR; ※ p < 0.05: CCA1 (50 μg/mL) vs CCA3 (50 μg/mL); ° P < 0.05:CCA1 (50 μg/mL) vs CCA1 (20 μg/mL).

