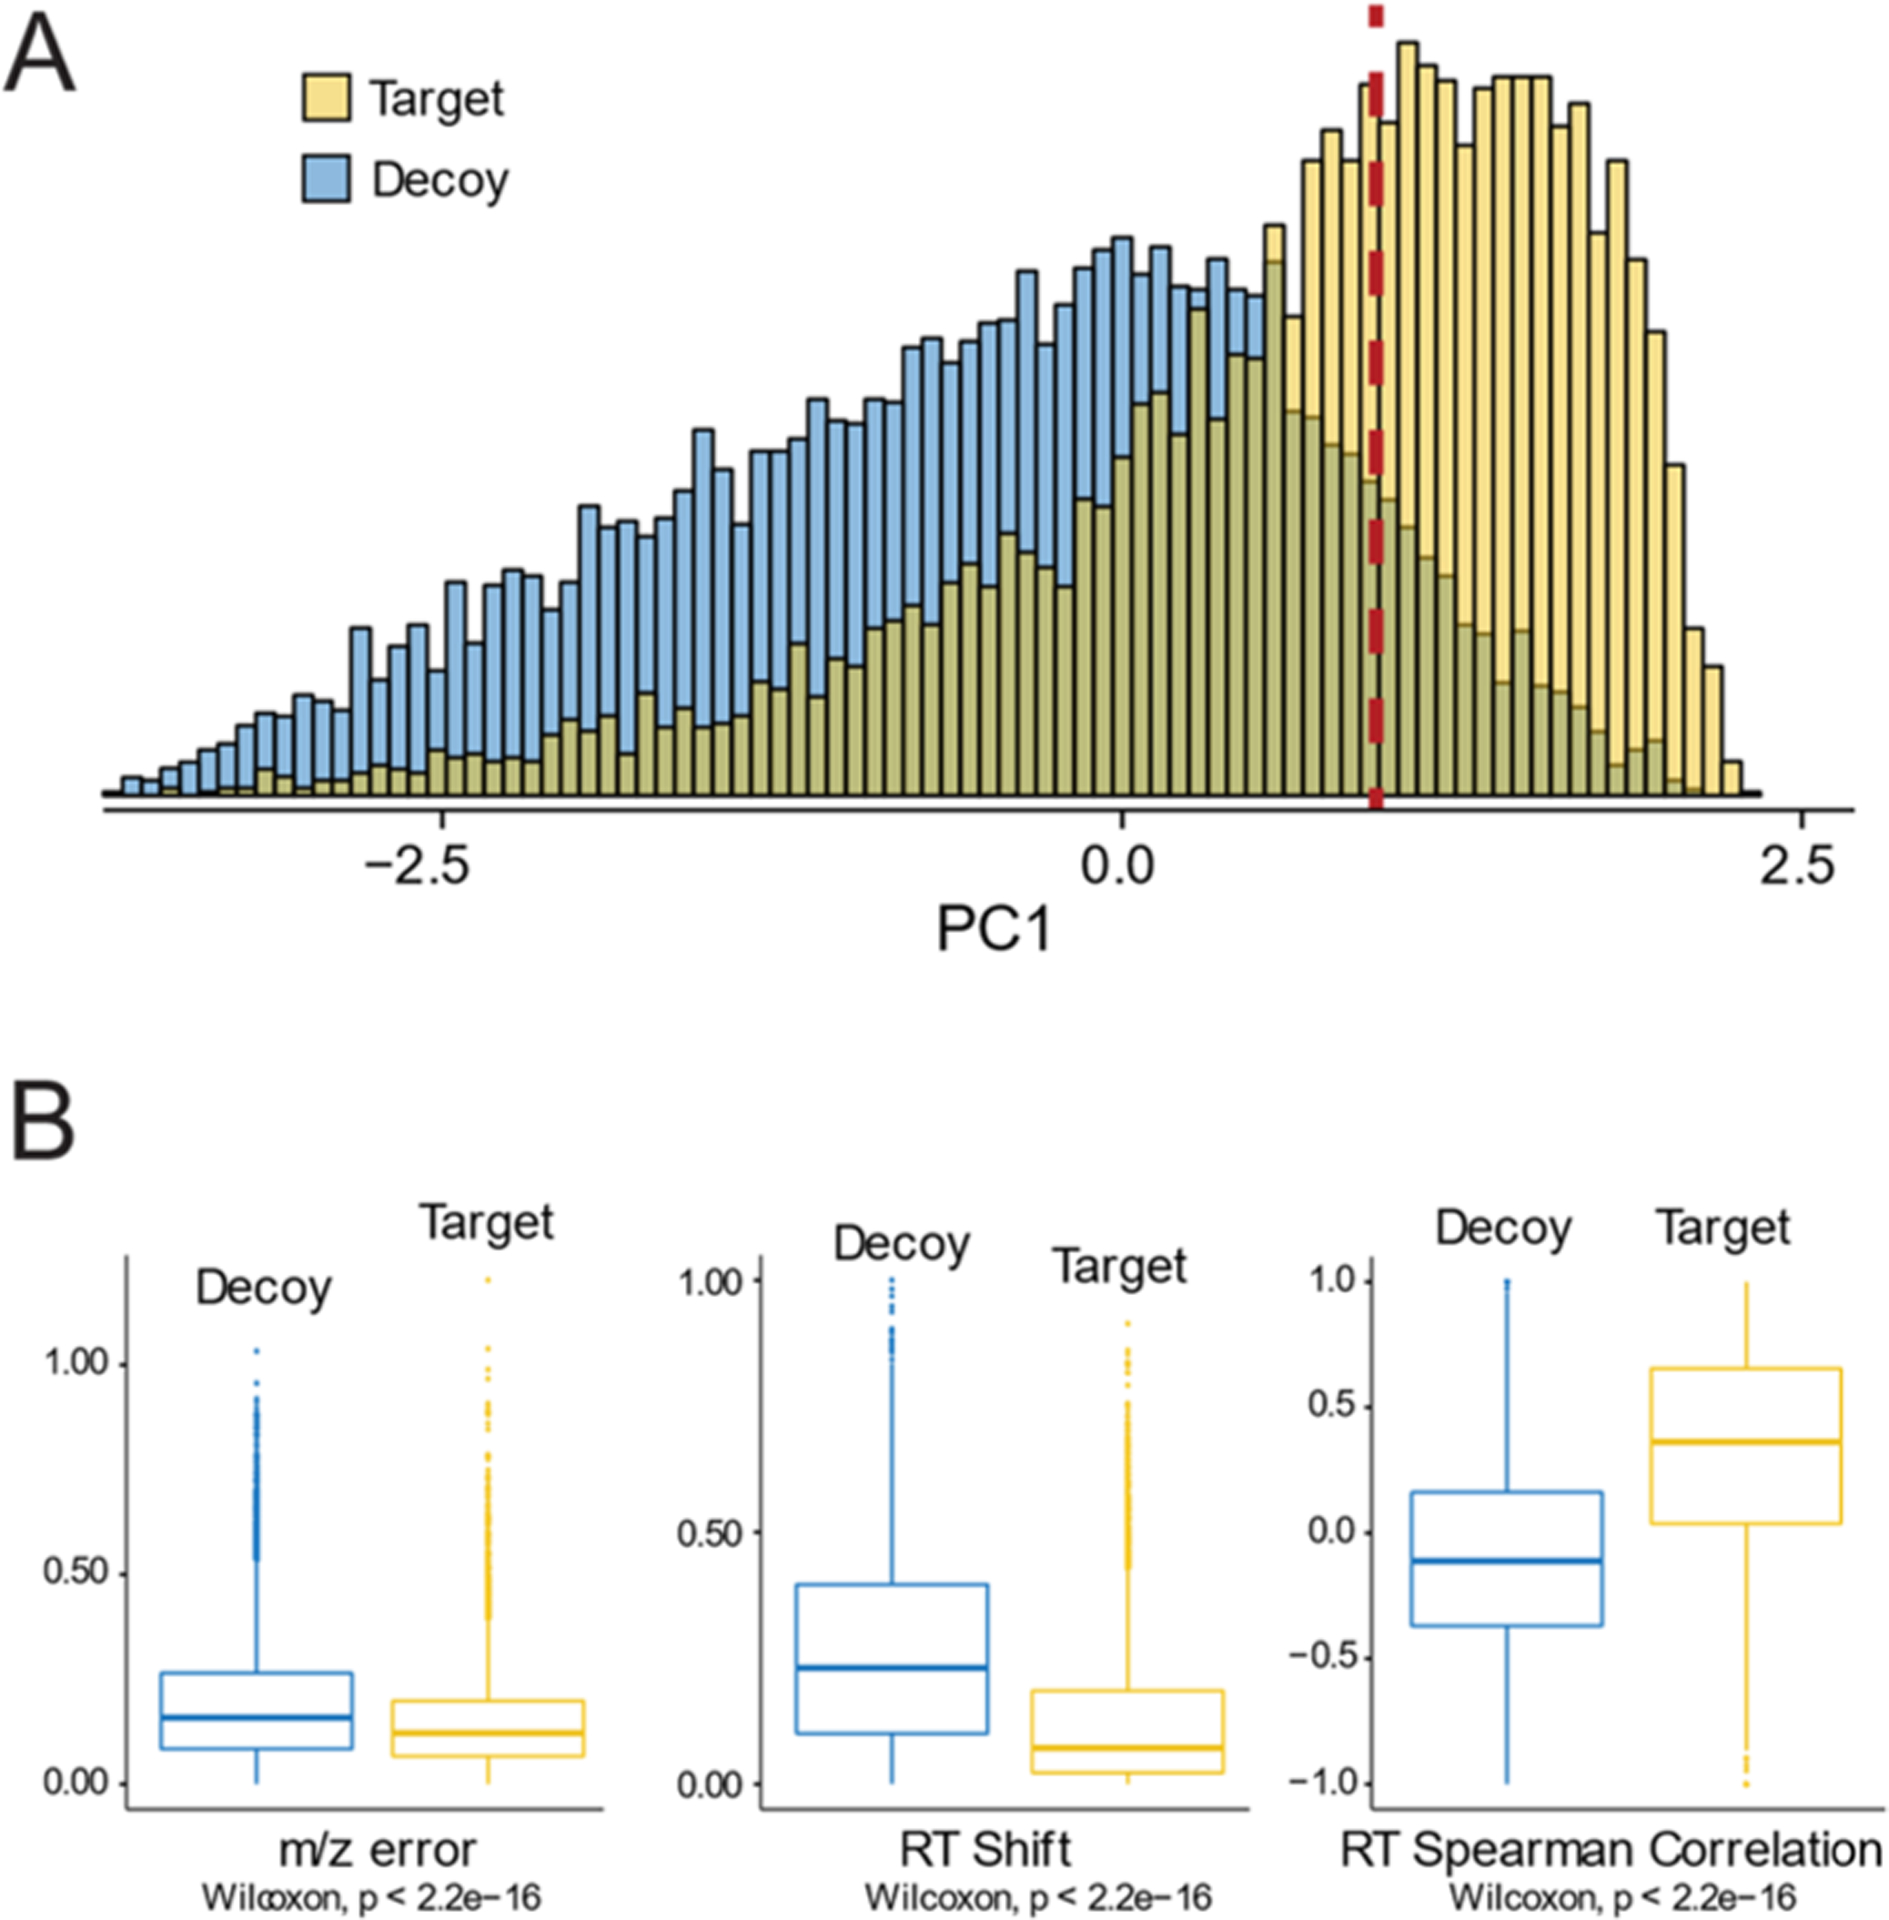
Figure 3.

Quality control scoring results. (A) Principal component analysis (PCA) of the quality parameters shown in (B) was used to calculate a quality score for each peptide. Methionine-containing peptides (target) for which a true −2 Da modification is expected to exist have better scores than non-methionine-containing peptides (decoy) for which no −2 Da modification is expected to exist. The red dotted line shows the principal component value at which there is a global 10% false positive rate (FPR). All subsequent data analyses are done on peptides with principal component scores that are better than the cutoff value represented by the red dotted line. (B) The three quality parameters used to calculate the principal component score (see Experimental Procedures) show a significant distinction between target and decoy peptides. For both (A) and (B), results from the baseline titration point (0.0 18O:1.0 16O) are shown as a representative example.
