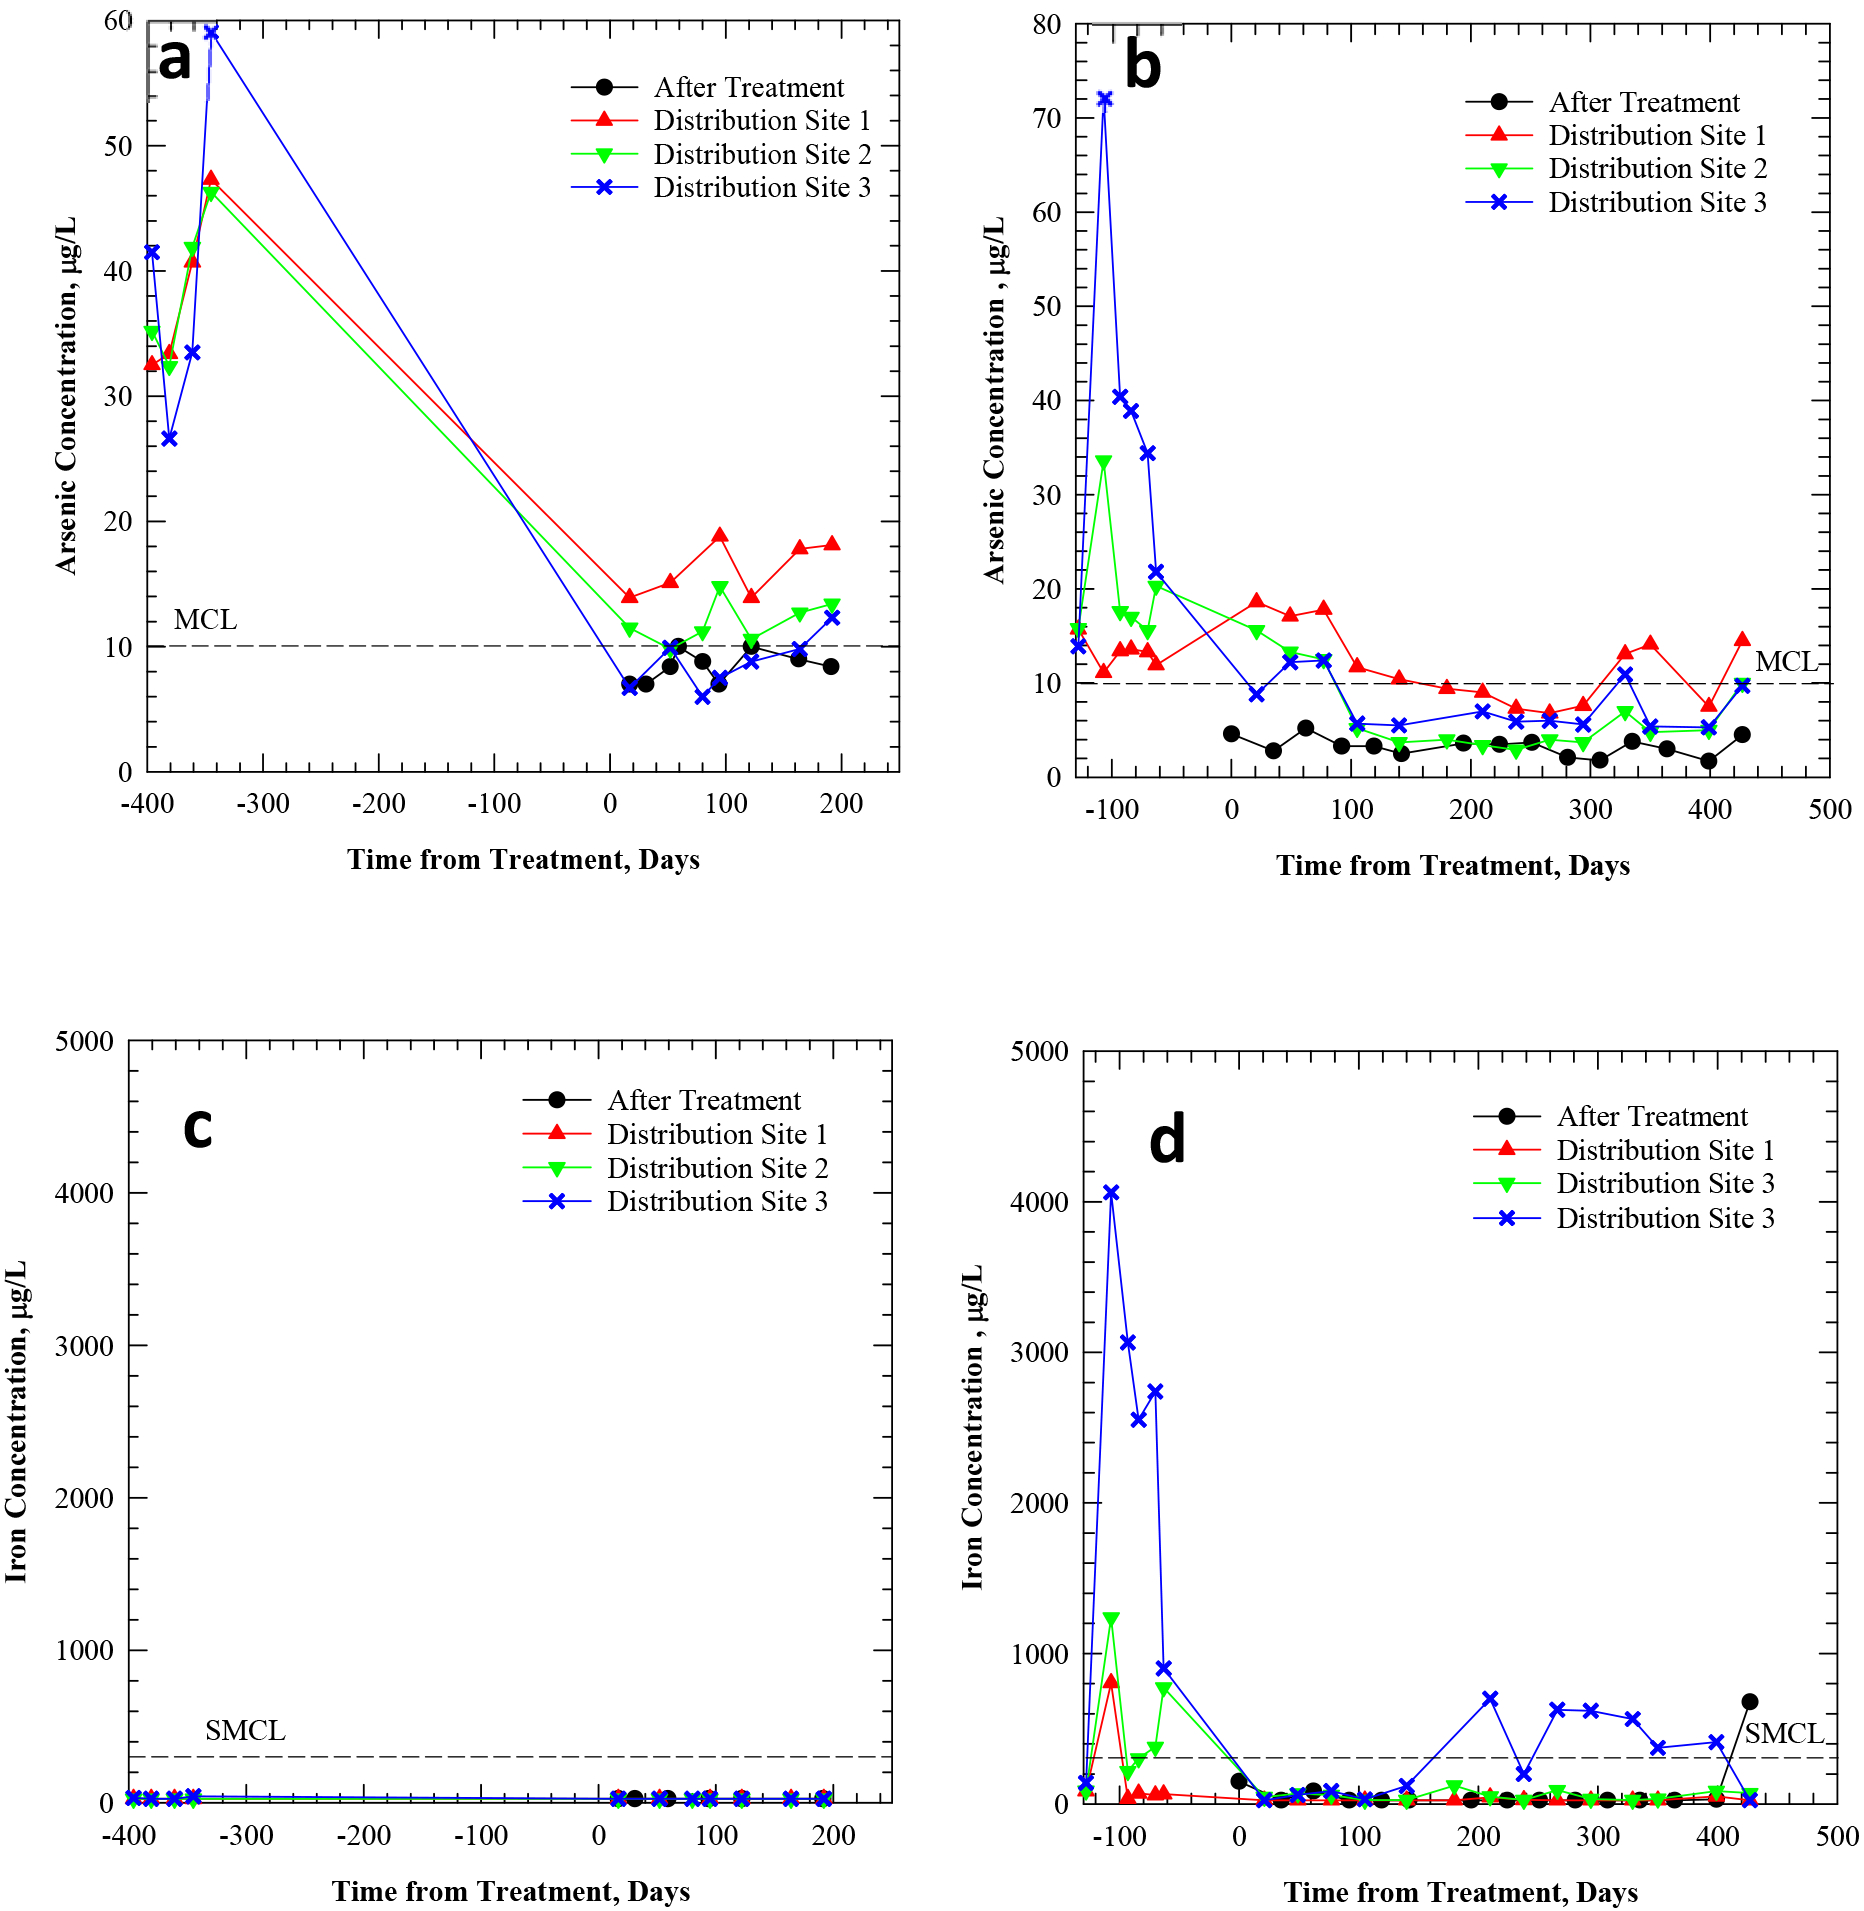
Figure 3.

Total arsenic concentration (a, b) and total iron concentration (c, d) in tap water of Pattern B systems LW and WV, before/after the installation of arsenic treatment. “After treatment” samples reflect water entering the distribution system. “Distribution site” samples reflect water exiting the distribution system at three consumer taps.
