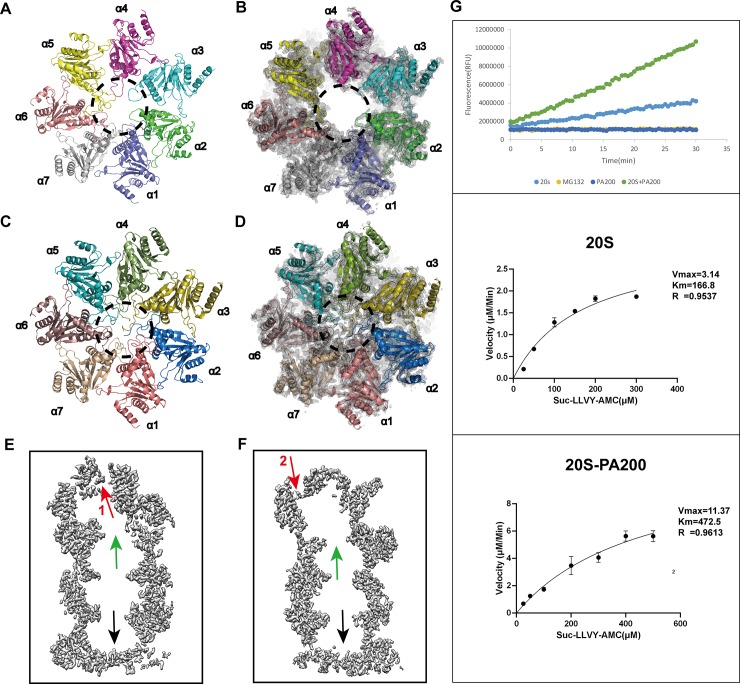
Fig 3. Gate opening and the peptidase activity of the 20S induced by PA200.
(A) After the combination of PA200, the gate of the 20S formed by top α subunits became disordered (shown within a dotted circle). (B) Close-up views of the top α-rings. The cryo-EM maps are shown as gray mesh and the atomic models as a cartoon. The N-terminals of the top α subunits became disorder and invisible. (C) The bottom gate of the 20S is closed because PA200 is not bound to it to induce gate opening. The N-terminals of all seven α-subunits point to the center of the hole and close the gate. (D) Close-up views of the bottom α-rings. The cryo-EM map (gray mesh) with a fitted atomic model (cartoon representation). Unlike panel B, the N-terminals of the bottom α subunits point to the central of the closed gate. (E) A surface cut of density map gives a clear sectional view with the open gate (green arrow) on top, closed bottom gate (black arrow), and opening 1 with the density map of the cofactor (red arrow). (F) The other cutting angle of the sectional view gives further proof of the two gates and the opening 2 with its cofactor map. (G) The proteasome activity of the 20S and PA200-20S was evaluated by the 20S proteasome assay kit, and Suc-LLVY-AMC was used as substrate. First, 20S CP and PA200-20S CP (2.5 nM) were incubated with 100 μM Suc-LLVY-AMC for 15 min at 25°C, and then fluorescence measurements (RFU) were taken at 30-s intervals and plotted against time. Data underlying these plots for top panel can be found in S1 Data. The chymotryptic-like activity of 20S and 20S-PA200 were analyzed at different concentrations of Suc-LLVY-AMC (25, 50, 100, 150, 200, 300 μM for 20S and 25, 50, 100, 200, 300, 400, 500 μM for 20S-PA200). The underlying numerical data and statistical analysis for middle and bottom panels can be found in S2 and S3 Data. CP, core particle; cryo-EM, cryo–electron microscopy; PA200, proteasome activator 200; RFU, relative fluorescence units.

