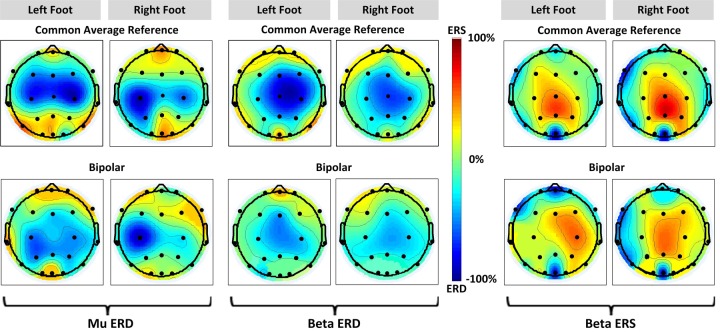
Fig 6. Average EEG topographies of ERD/ERS during foot KMI of all participants.
Mu ERD is shown in the left column for left foot and right foot respectively, following this, beta ERD is in the mid column, and beta ERS is in the right column with distinguished ERS pattern. The top row illustrates ERD/ERS patterns for common average reference and the bottom for bipolar reference.

