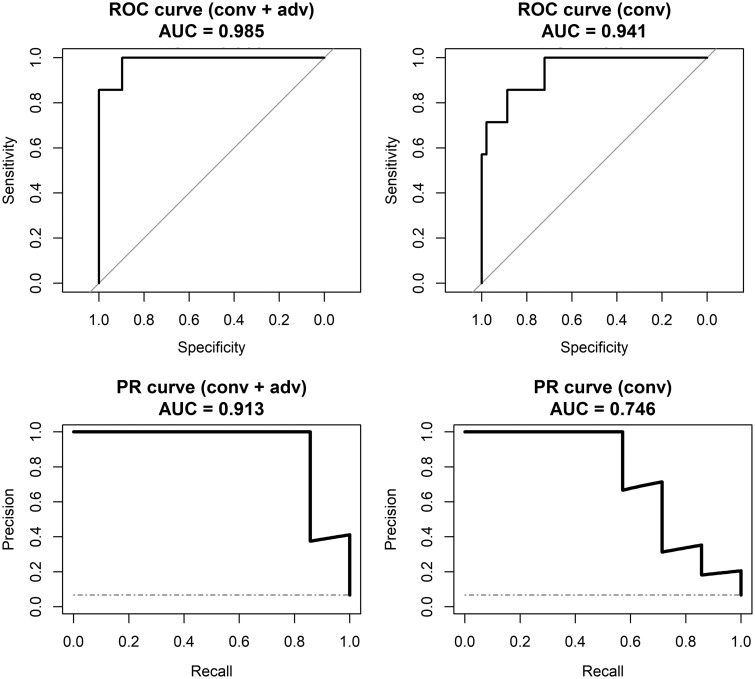
Fig 2.
ROC and precision-recall (PR) curves for distinguishing high-grade samples versus normal tissue and low-grade disease samples. Plots in the left columns are based on the predictions from the random forest model using conventional and advanced imaging, whereas plots on the right are based on models using conventional imaging only. Although the area under the ROC curves is similar, the area under the PR curve is much smaller for conventional imaging only. The diagonal lines on the ROC curves and horizontal dashed lines on PR curves show the performance of a no-information or random classifier. Conv indicates conventional; adv, advanced; AUC, area under the curve.

