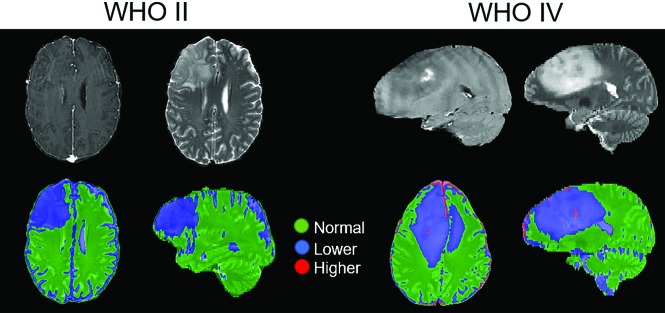
Fig 3.
A clinically relevant map of the predicted tumor grade using the highest probability grade and smoothed by a median filter (2-voxel radius) superimposed on a T2-weighted image. Green, blue, and red correspond to predicted normal tissue and lower-grade and higher-grade disease, respectively. Shown on the left is a WHO grade II oligodendroglioma with a T2-weighted image for reference, and on the right is a WHO grade IV glioblastoma with a T1 postcontrast image for reference (upper part). The classifier identifies the oligodendroglioma as containing only lower-grade disease, while the glioblastoma has a central region of higher grade near the enhancing-focus disease surrounded by lower-grade disease. Areas of normal brain falsely identified as tumor (ie, sulcus) are unlikely to confuse a clinician.

