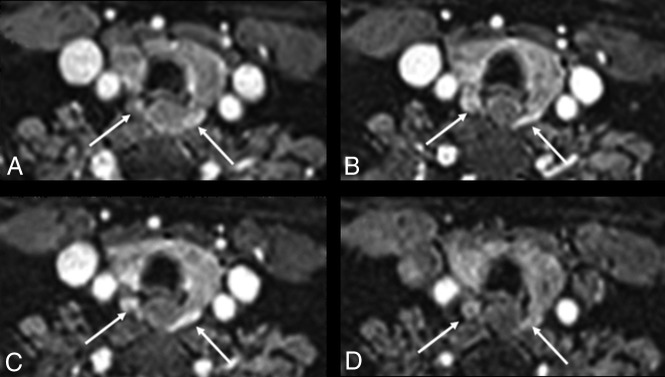
Fig 1.
A 39-year-old woman with PHPT and MGD with bilateral glands imaged in the lower quadrants. A, Axial early arterial phase. B, Early venous phase. C, Midvenous phase. D, Later venous phase. The contour of the glands is different in A and B due to interval patient motion without image degradation. Images show bilateral MGD glands (white arrows) with early arterial enhancement and increased signal intensity compared with the adjacent thyroid gland (A). Signal intensity increases into the early venous phase, with MGD glands having signal intensity similar to that of the carotid artery on the early venous phase and increased signal compared with the thyroid gland (B). At the mid-venous phase, the MGD glands have decreased signal intensity compared with the carotid artery due to early washout but still have increased signal compared with the thyroid gland (C). The MGD gland signal decreases further in the later venous phase, becoming isointense with the thyroid gland (D).

