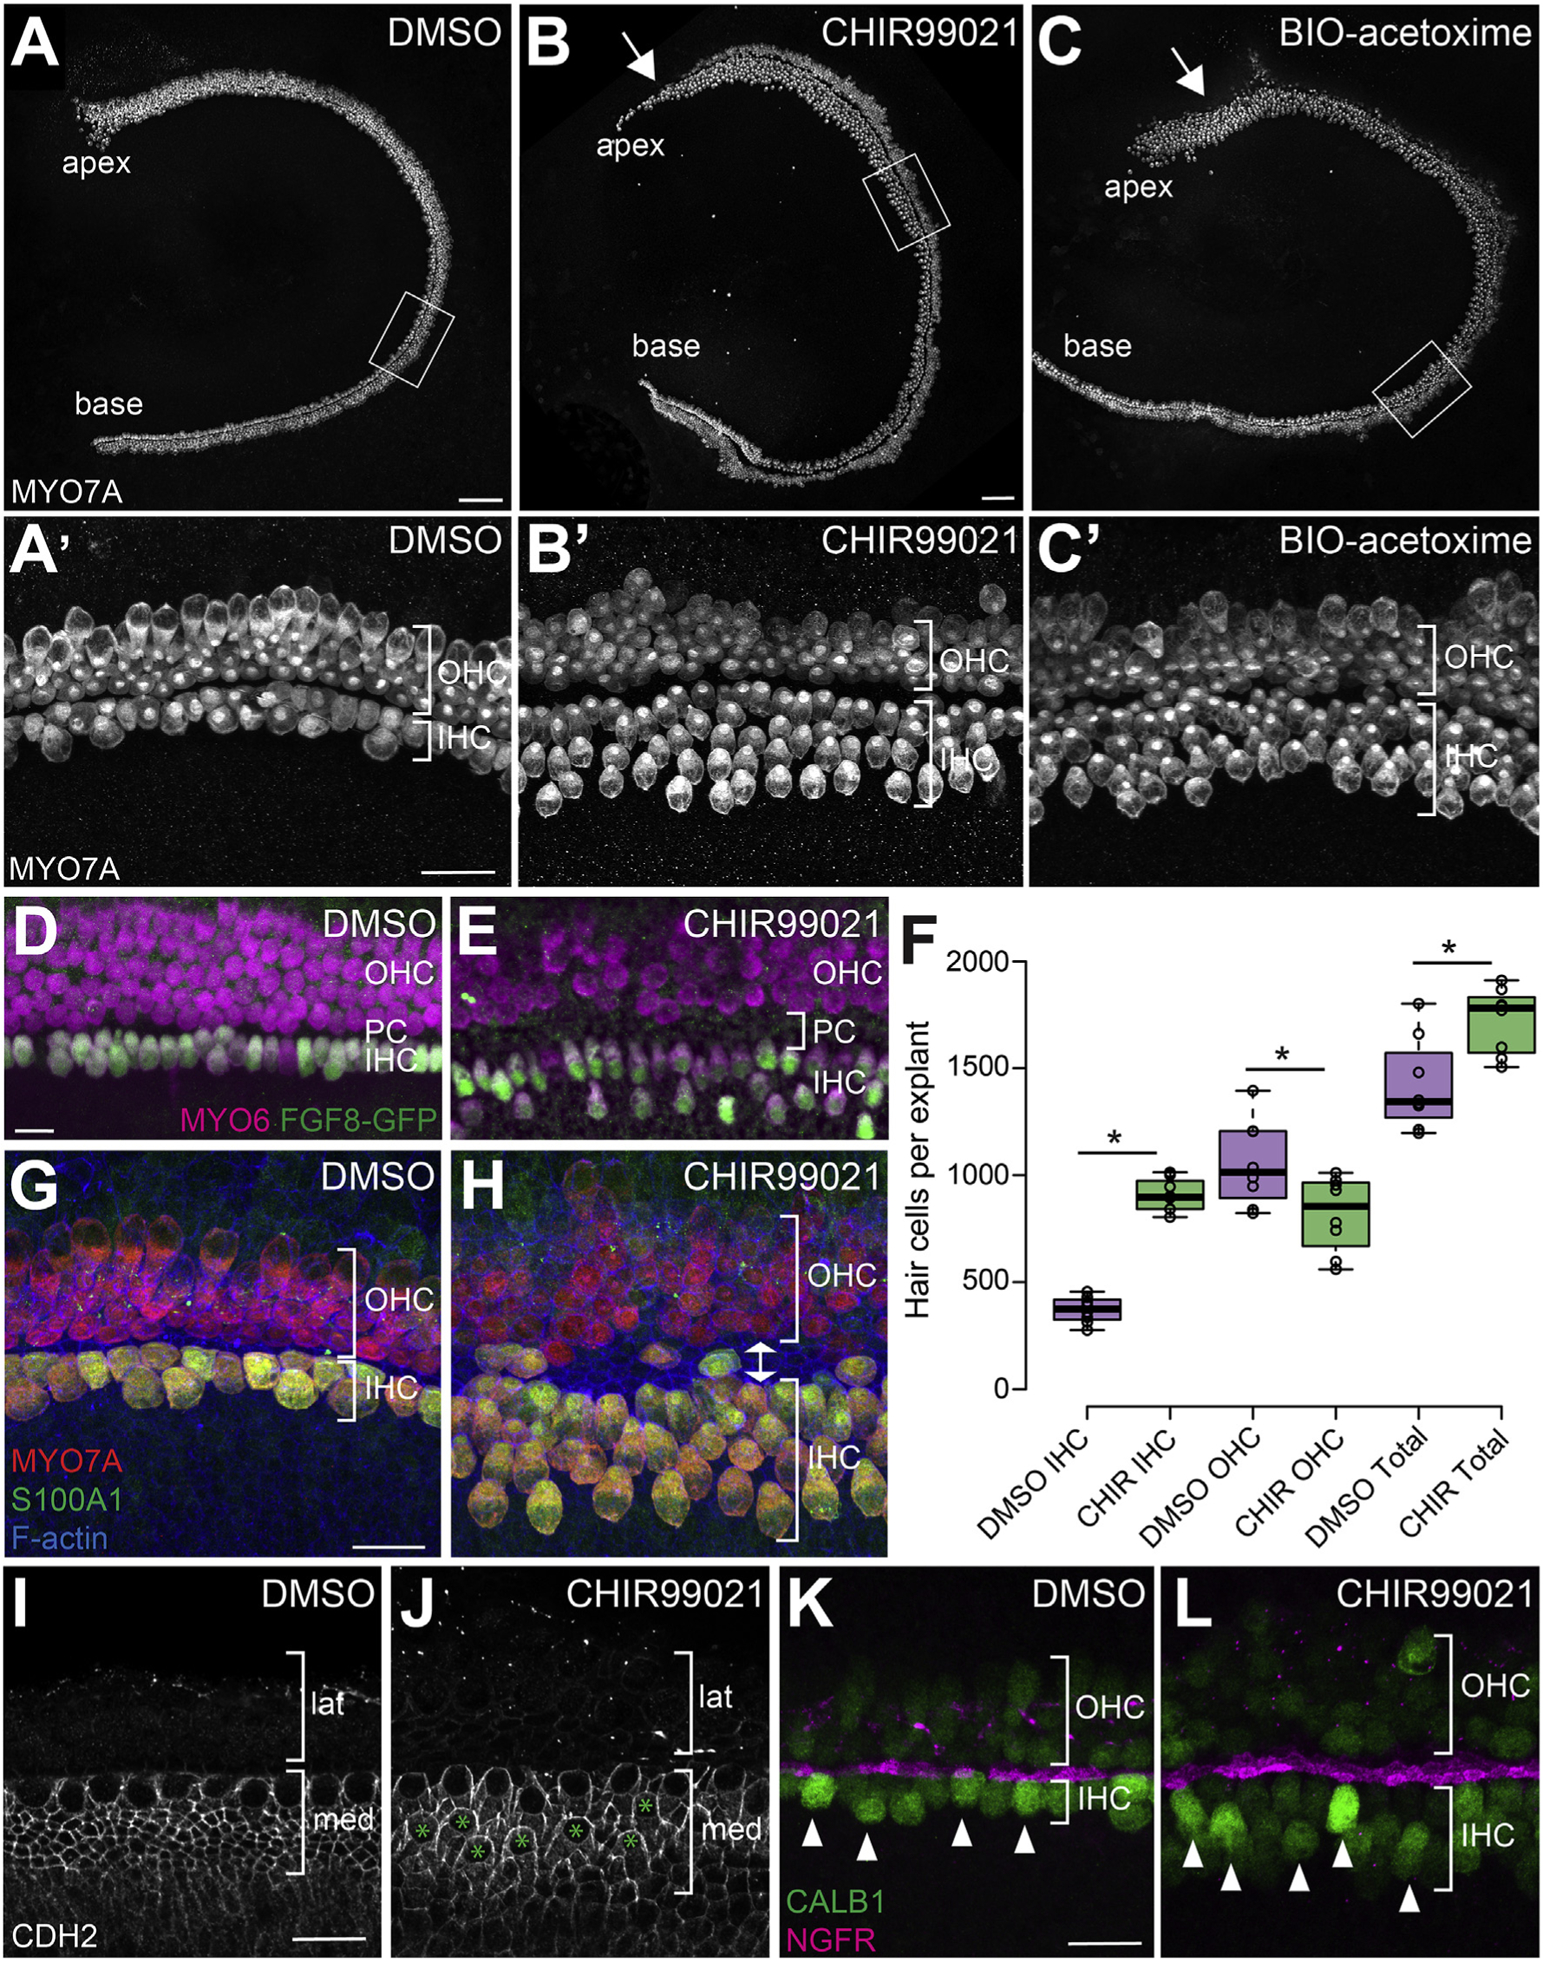
Fig. 3. Inhibition of GSK3 leads to an increase in IHCs and a decrease in OHCs.

A-C. Inhibition of GSK3 in cochlear explants using 2 μM CHIR99021 (B) or 1 μM BIO-acetoxime (C) results in an increase in the number of IHCs and a decrease in the number of OHCs compared to DMSO-treated controls (A). Hair cells are labeled with anti-MYO7A. A′-C’. Magnified view of hair cells in the middle region of explants (boxed regions in A-C) illustrating the difference in IHC and OHC numbers between control and GSK3-inhibited samples. Note the significant increase in the number of IHCs and the relative decrease in OHCs. D-E. Magnified view of explants from Fgf8GFP cochlea showing that extra IHCs in GSK3-inhibited cochleae are positive for Fgf8. All hair cells labeled with anti-MYO6 in magenta. IHCs labeled with anti-GFP (Fgf8) in green. Bracket in E indicates the increased PC region (increased distance between rows of IHCs and OHCs). F. Quantification of the change in number of IHCs, OHCs, and total HCs as a result of inhibition of GSK3. DMSO-treated control explants N = 8. CHIR-treated explants N = 8. Difference in IHCs p <0.0001. Difference in OHCs p = 0.025. Difference in total hair cells p = 0.007. G, H. Labeling with anti-S100A1 (green), which marks IHCs and Deiters’ cells, confirms extra hair cells on medial side are specified as IHCs. Double arrow in H shows extra width of PC region in CHIR-treated explants. I, J. Anti-N-cadherin (CDH2) staining is found in the medial (med) but not lateral (lat) domain of DMSO (I) and CHIR-treated (J) explants. Extra IHCs (green asterisks in J) and surrounding SCs are CDH2-positive. K, L. Anti-Calbindin (CALB1, green) staining is brighter in both endogenous and supernumery IHCs (arrowheads), relative to OHCs. IHCs and OHCs are separated by IPCs stained by anti-NGFR (magenta). Scale bars (A–C) = 100 μm. Scale bars (A′–C′) = 25 μm. Scale bars (D–L) = 20 μm.
