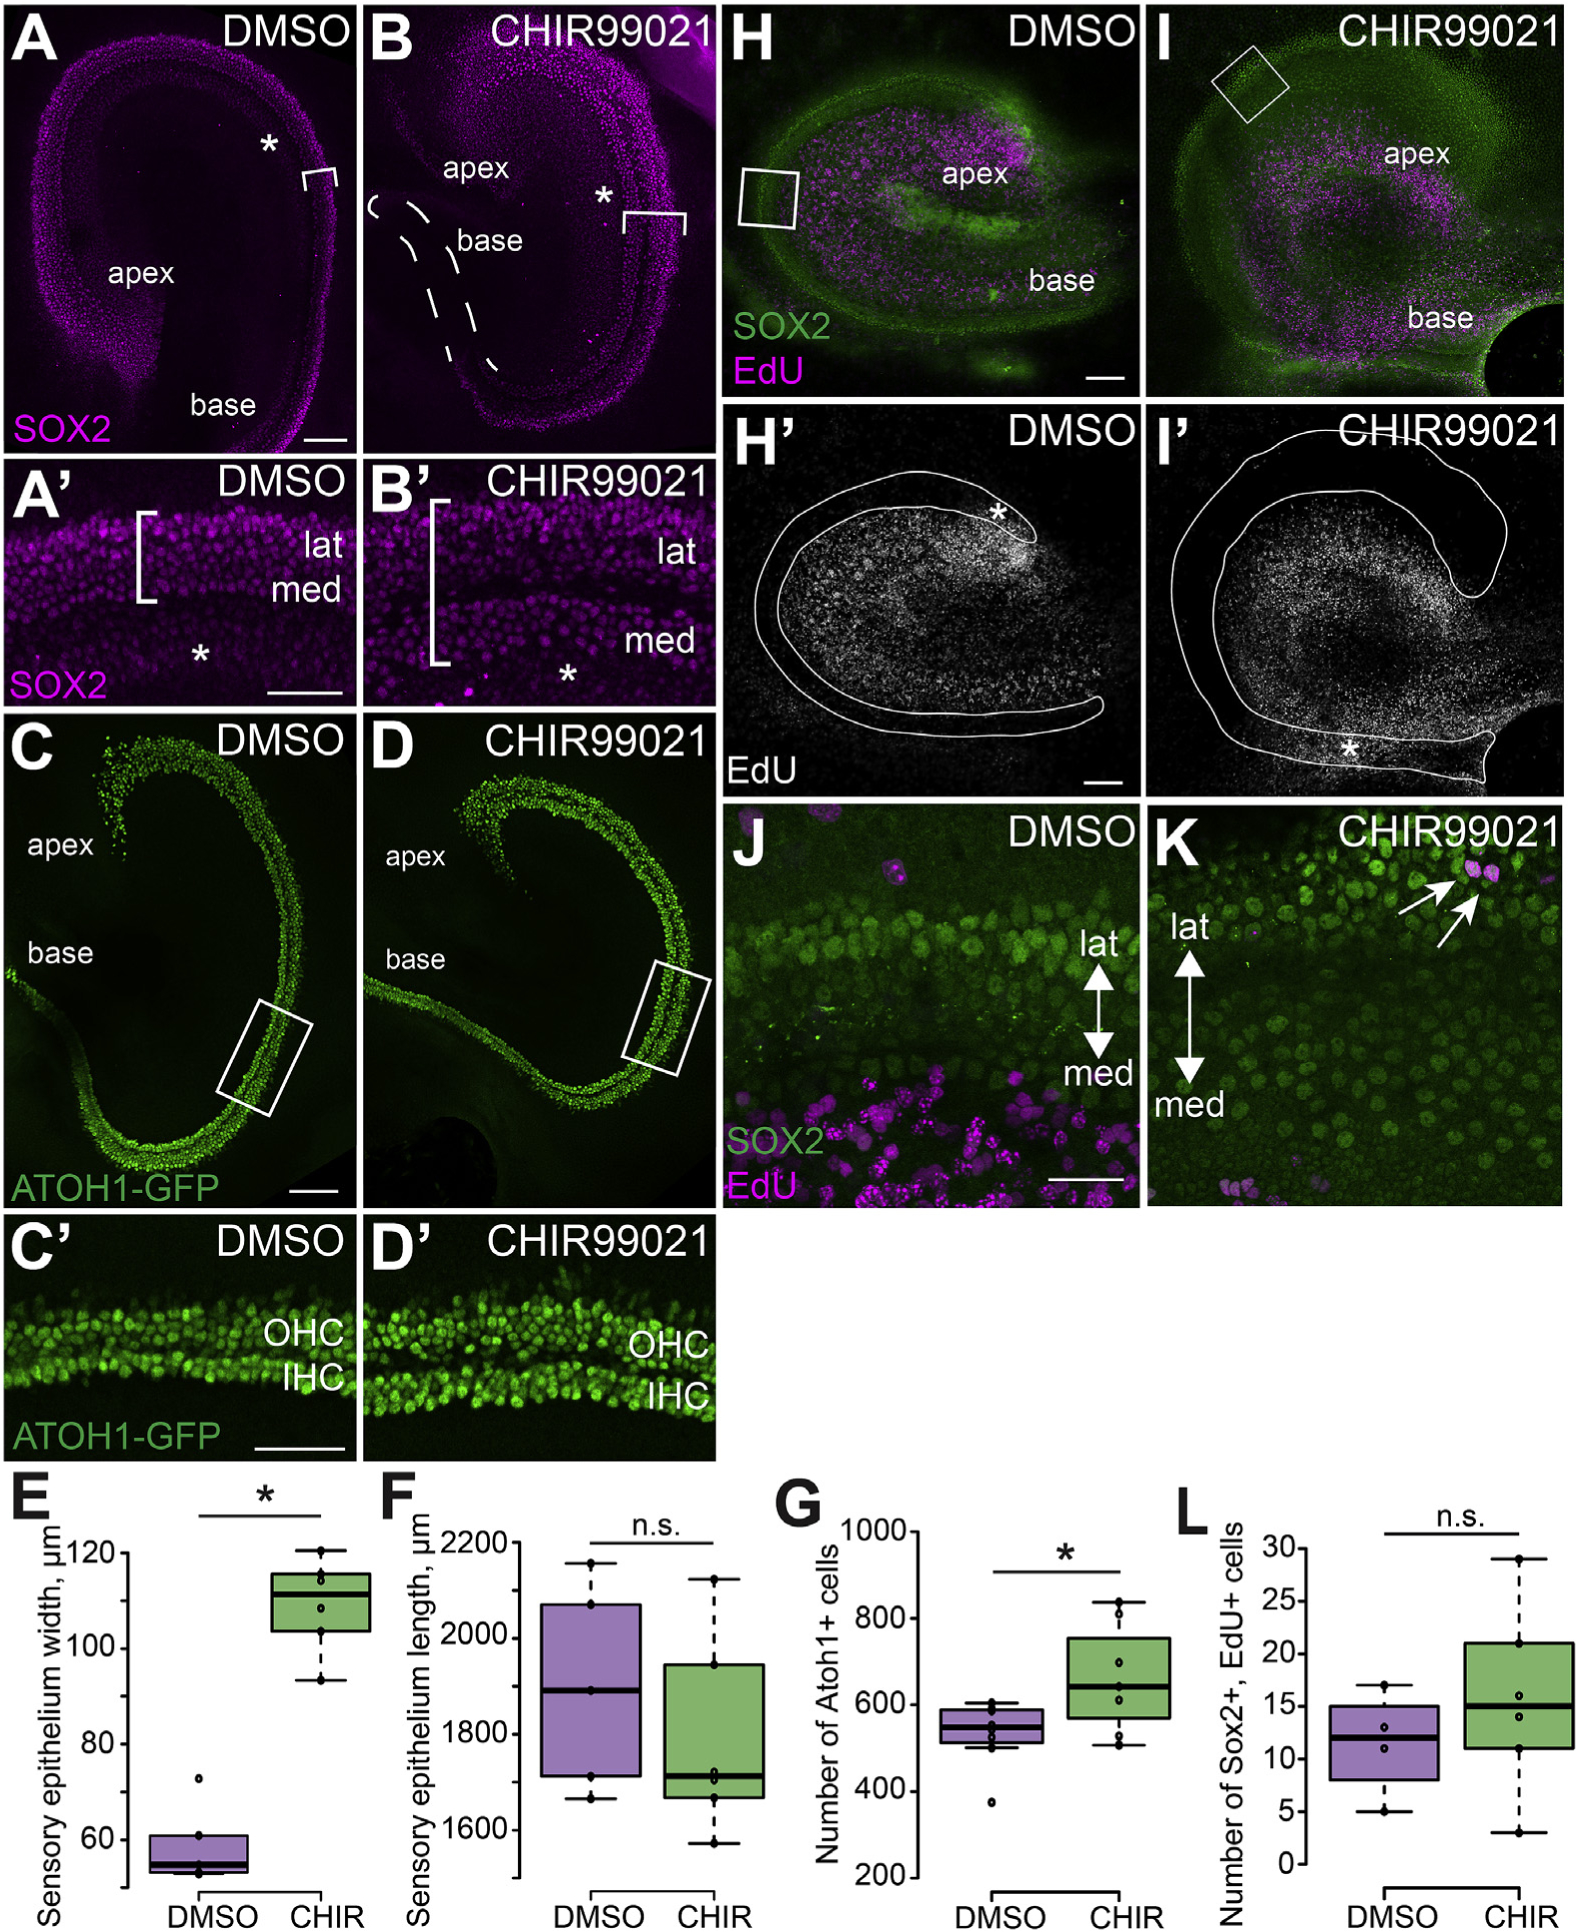
Fig. 5. Inhibition of GSK3 causes an increase in the size of the prosensory domain but does not increase cell proliferation.

A, B. Cochlear explants established at E13.5 and fixed at E15.5. Labeling with anti-SOX2 (magenta) illustrates the increased size of the prosensory domain (brackets) in explants treated with CHIR (B) as compared to controls (A). This expansion is especially pronounced in the medial domain. Asterisks label low level expression of SOX2 in Kölliker’s organ. Dashed line in B outlines the basal prosensory region. A′, B’. High magnification images of the middle regions from the explants in A and B showing the expanded medial domain. The width of the SOX2 positive prosensory domain is indicated by the brackets. Asterisks label low level expression of SOX2 in Kölliker’s Organ. C, D. Expression of Atoh1GFP indicates increased initial formation of hair cells in explants treated with CHIR (D) as compared to DMSO-treated controls (C). C′, D’. High magnification views of the boxed regions in C and D illustrating increased Atoh1GFP+ IHCs in an explant treated with CHIR. Note that these images are rotated 90° relative to the images in C and D. E, F. Quantification of sensory epithelium width (measured at the mid-point of each explant) and overall length in explants established at E13.5 and fixed at E15.5. CHIR-treatment leads to a significant increase in the width of the developing sensory epithelium while the length remains unchanged. DMSO-treated explants N = 5. CHIR-treated explants N = 6. Width p <0.0001. Length p = 0.411. (G) Quantification of average number of Atoh1GFP+ hair cells counted in a 750 μm stretch in the middle region of DMSO-treated explants (N = 8) and CHIR-treated explants (N = 7). Atoh1GFP+ hair cells are significantly increased following CHIR-treatment. p = 0.045. H – K. Cochlear explants were established at E13.5 and treated with EdU for 24 h from E13.5 – E14.5. Explants were maintained in medium containing DMSO or CHIR for an additional 24 h and then fixed. EdU-positive nuclei (magenta) in the sensory epithelium were identified based on co-expression of SOX2 (green) in DMSO-treated control (H) and CHIR-treated explants (I). Note that there is minimal overlap between EdU+ cells and Sox2+ cells. H′, I’. The same images as in H and I but showing only the EdU labeling. The sensory epithelium is outlined based on expression of SOX2. Asterisks indicate proliferating mesenchymal cells located below the basement membrane of the sensory epithelium. Mesenchymal proliferation was consistently seen across all cultures. J, K. Magnified view of the middle regions of control (J) and CHIR-treated (K) cochlear explants (boxed regions in H and I) showing a few cells that are colabeled with SO×2 and EdU. Arrows indicate SOX2 and EdU double positive cells. Double-positive cells were almost always found in the lateral domain. Note that these images are rotated relative to the images in H and I. L. Quantification of SOX2 and EdU double-positive cells. DMSO and EdU treated explants N = 4. CHIR and EdU treated explants N = 6. Difference between DMSO and CHIR explants double positive cells p = 0.371. Scale bars (A, B, C, D, H, I) 100 μm. Scale bars (A′, B′) = 50 μm. Scale bars (J, K) = 25 μm.
