
FIGURE 8.
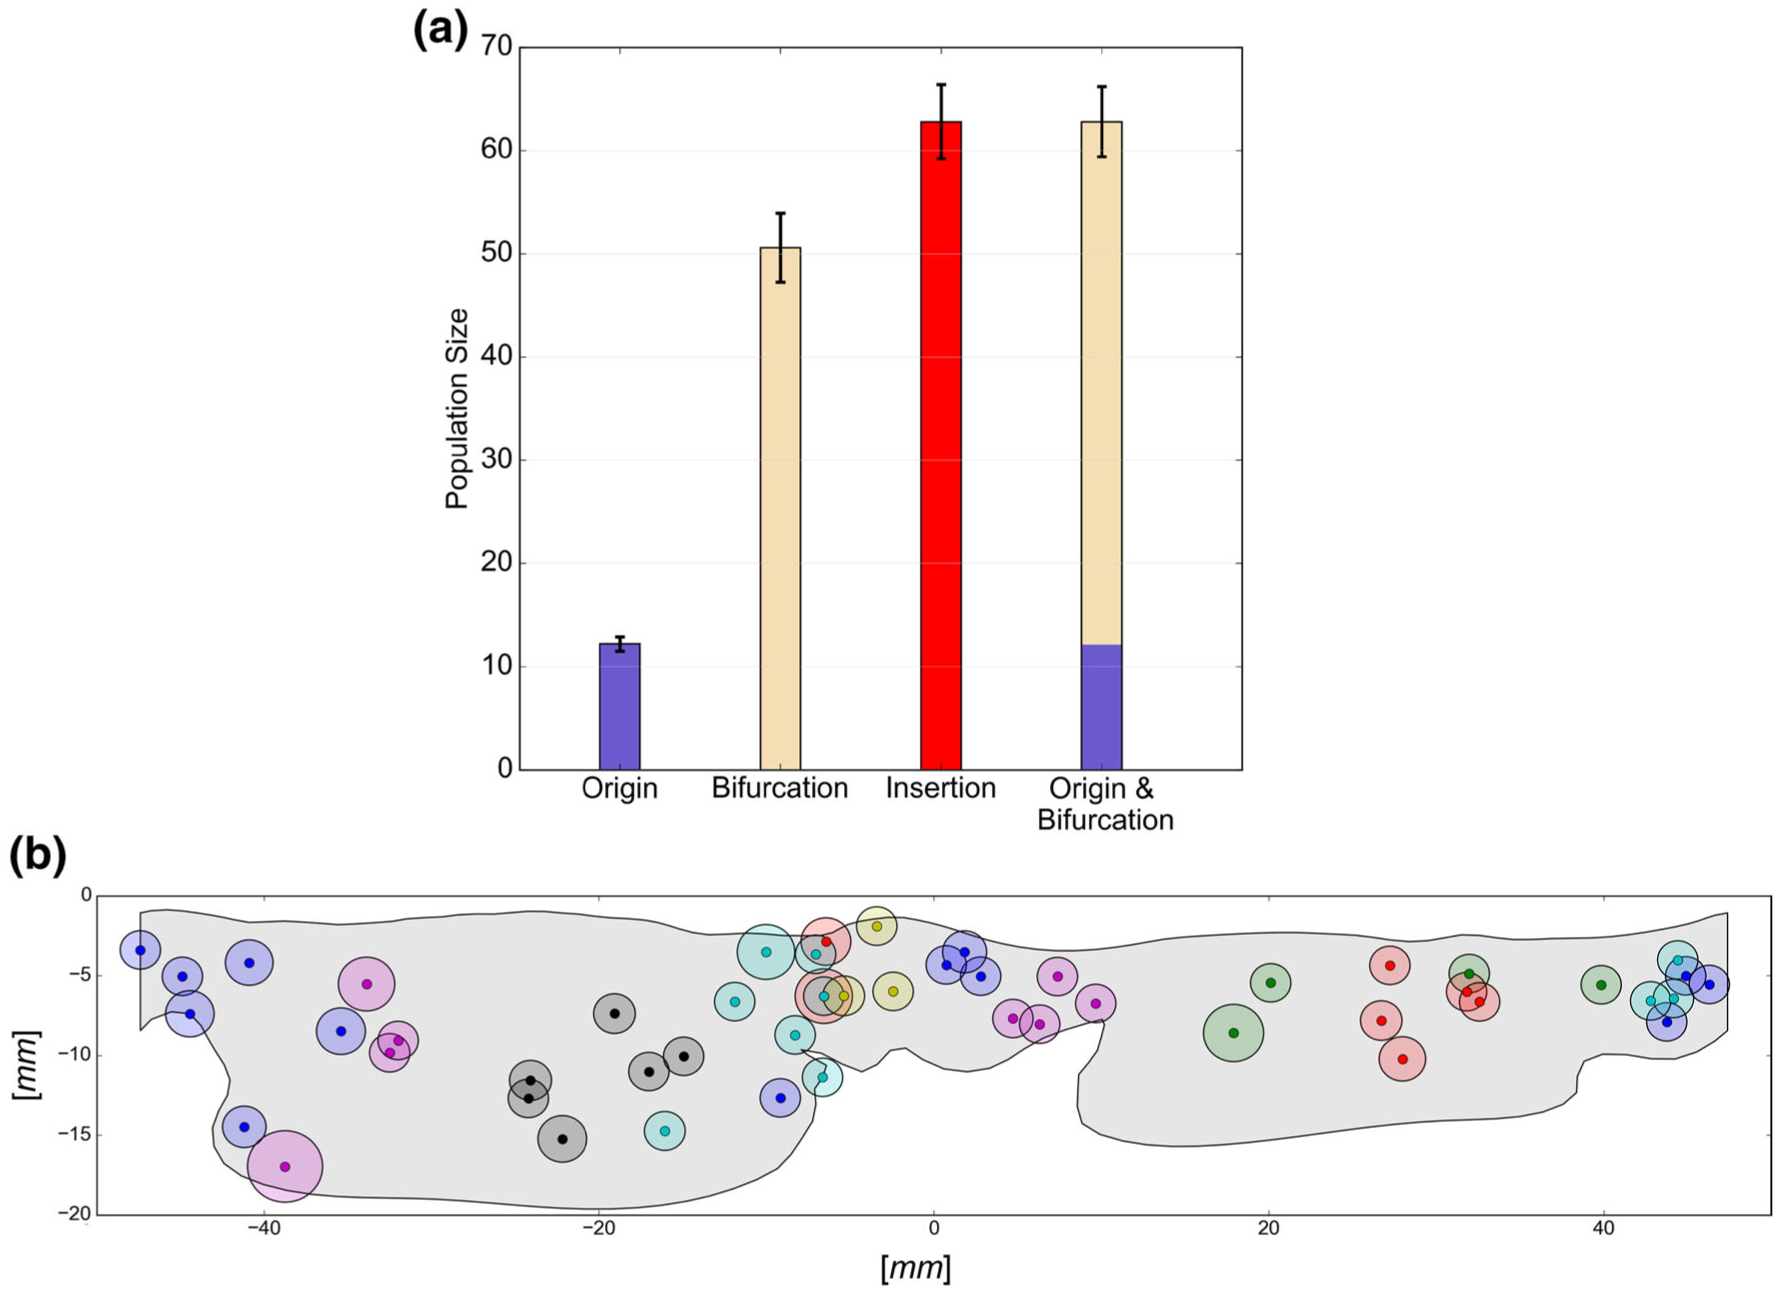
(a) Shows the relationship between the number of origin, branching, and insertion locations within each MV: bar graphs represent the average values, error bars represent standard errors. Following the full binary tree structure, the number of insertions always equals to the summation of origin and branching points. In (b), the insertion locations of an individual valve’s CT are shown in the cylindrical coordinate system overlaid with MV leaflet outline.