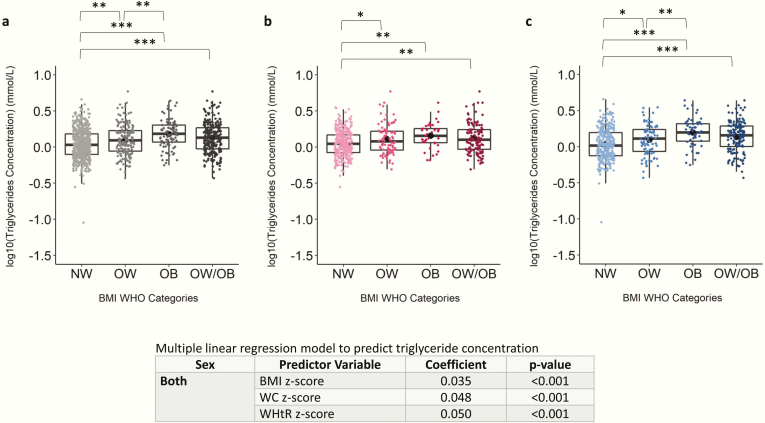
Figure 3.
Scatter boxplot of log(triglyceride) concentration in normal weight (NW), overweight (OW), obese (OB), and overweight and obese combined (OW/OB) groups. Plots depict data from children and adolescents aged 5 to <19 years for (A) both sexes, (B) females only, and (C) males only. Log(triglyceride) concentration was compared between NW, OW, and OB using ANOVA and Tukey post hoc test and were compared between NW and OW/OB using independent samples t test. Coefficient and P values of multiple linear regression models to predict triglyceride concentration are shown. All models are adjusted by age and sex. The Benjamini-Hochberg procedure was applied to control for false discovery rate because of multiple comparisons at an alpha level of .05. *P < .05; **P < .01; ***P < .001. Abbreviations: BMI, body mass index; WHO, World Health Organization.

