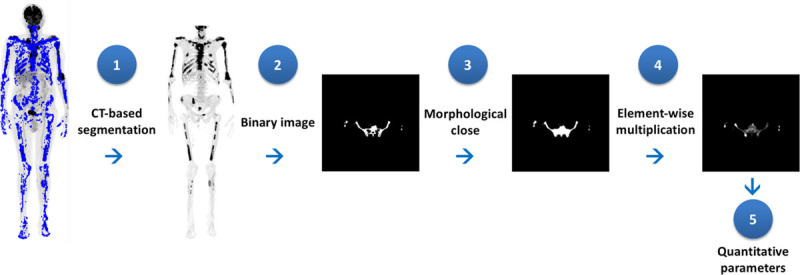
Fig. 1.

Flowchart for quantitative PET metrics: a CT–based segmentation, masked PET conversion to binary image, morphological closing and element-wise multiplication between closed image and original 18F-FDG PET image, and finally, quantitative metrics calculation. CT, Computed tomography; 18F-FDG PET, fluorine 18 fluorodeoxyglucose PET.
