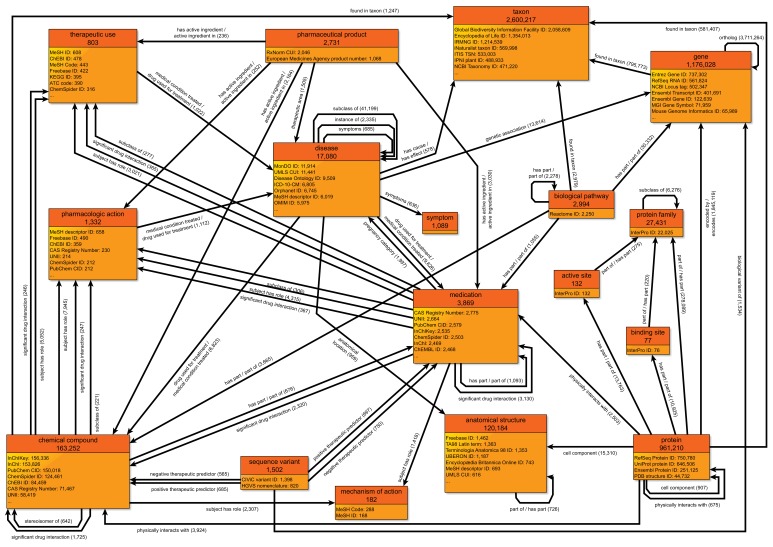
Figure 1. A simplified class-level diagram of the Wikidata knowledge graph for biomedical entities.
Each box represents one type of biomedical entity. The header displays the name of that entity type (e.g., pharmaceutical product) and the number of Wikidata items for that entity type. The lower portion of each box displays a partial listing of attributes about each entity type and the number of Wikidata items for each attribute. Edges between boxes represent the number of Wikidata statements corresponding to each combination of subject type, predicate, and object type. For example, there are 1505 statements with 'pharmaceutical product' as the subject type, 'therapeutic area' as the predicate, and 'disease' as the object type. For clarity, edges for reciprocal relationships (e.g., 'has part' and 'part of') are combined into a single edge, and scientific articles (which are widely cited in statement references) have been omitted. All counts of Wikidata items are current as of September 2019. The most common data sources cited as references are available in Figure 1—source data 1. Data are generated using the code in https://github.com/SuLab/genewikiworld (archived at Mayers et al., 2020). A more complete version of this graph diagram can be found at https://commons.wikimedia.org/wiki/File:Biomedical_Knowledge_Graph_in_Wikidata.svg.


