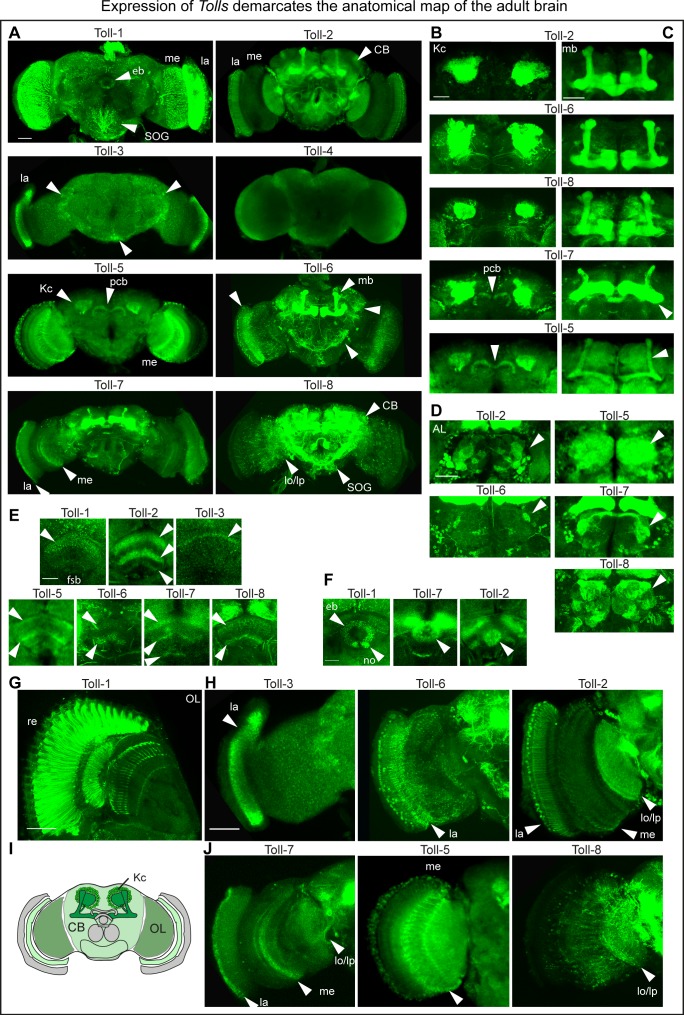
Figure 1. Expression of Tolls demarcates the anatomical map of the adult brain.
(A) Toll receptor expression visualised with: Anti-Toll-1 antibodies, in retinal photoreceptors; CRISPR/Cas9 generated Toll-2pTVGAL4 > FlyBow, throughout the brain; MIMIC-RMCE generated Toll-3GAL4 > tdTomato restricted to the lamina; CRISPR/Cas9 generated Toll-4GAL4 > FlyBow did not reveal any signal; CRISPR/Cas9 generated Toll-5GAL4 > FlyBow was prominent in medulla, Kenyon cells and protocerebral bridge (pb). (Unfortunately, we could not get CRISPR/Cas9 data for Toll-9). MIMIC-RMCE generated Toll-6GAL4 > tdTomato is prominent in lamina, Kenyon cells and central brain interneurons. MIMIC-RMCE generated Toll-7GAL4 > FlyBow was prominent in optic lobe and Kenyon cells. Toll-8GAL4MD806 > tdTomato was prominent in central brain and Kenyon cells. (B–G) Higher magnification views to show signal in: (B) Kenyon cells (KCs); (C) mushroom bodies (mb); (D) antennal lobes (AL); (E) fan shaped body (fsb); (F) ellipsoid body (eb); (G,H,J) optic lobes (OL). (I) Drawing illustrating the brain domains of KCs, central brain (CB) and OLs used for the functional analysis. La: lamina; me: medulla; lo: lobula; lp: lobula plate; no: noduli; pcb: protocerebral bridge. Scale bars: A,E,F,G: 25 μm; B,C,D,H,J: 50 μm. For genotypes and sample sizes see Materials and methods and Supplementary file 2. See Figure 1—figure supplement 1.


